The harness is everything a change waits on after it is written: the local reviews, the tests, the check in a real browser, and CI on every push. Every check, review and gate you add makes each change a little slower and a little more expensive, and you never feel the total. It takes the time a few minutes at a time, so no single round looks like a problem. In Cockpit, most pull requests spend longer in the harness than on writing the code.
So the harness needs managing like the product itself: measure it all the time, and review it on a schedule. I do the first with the Harness Monitor, a set of reports that CI and the build feed on every run. I do the second with one skill, /harness-cost-review, once a month.
Measure it: the Harness Monitor
You can't manage what you don't see, and Git and GitHub only know when a pull request opened and merged. For Cockpit, the Harness Monitor holds the numbers the harness produces itself, and answers one question per report. Its source is in apps/harness-monitor.
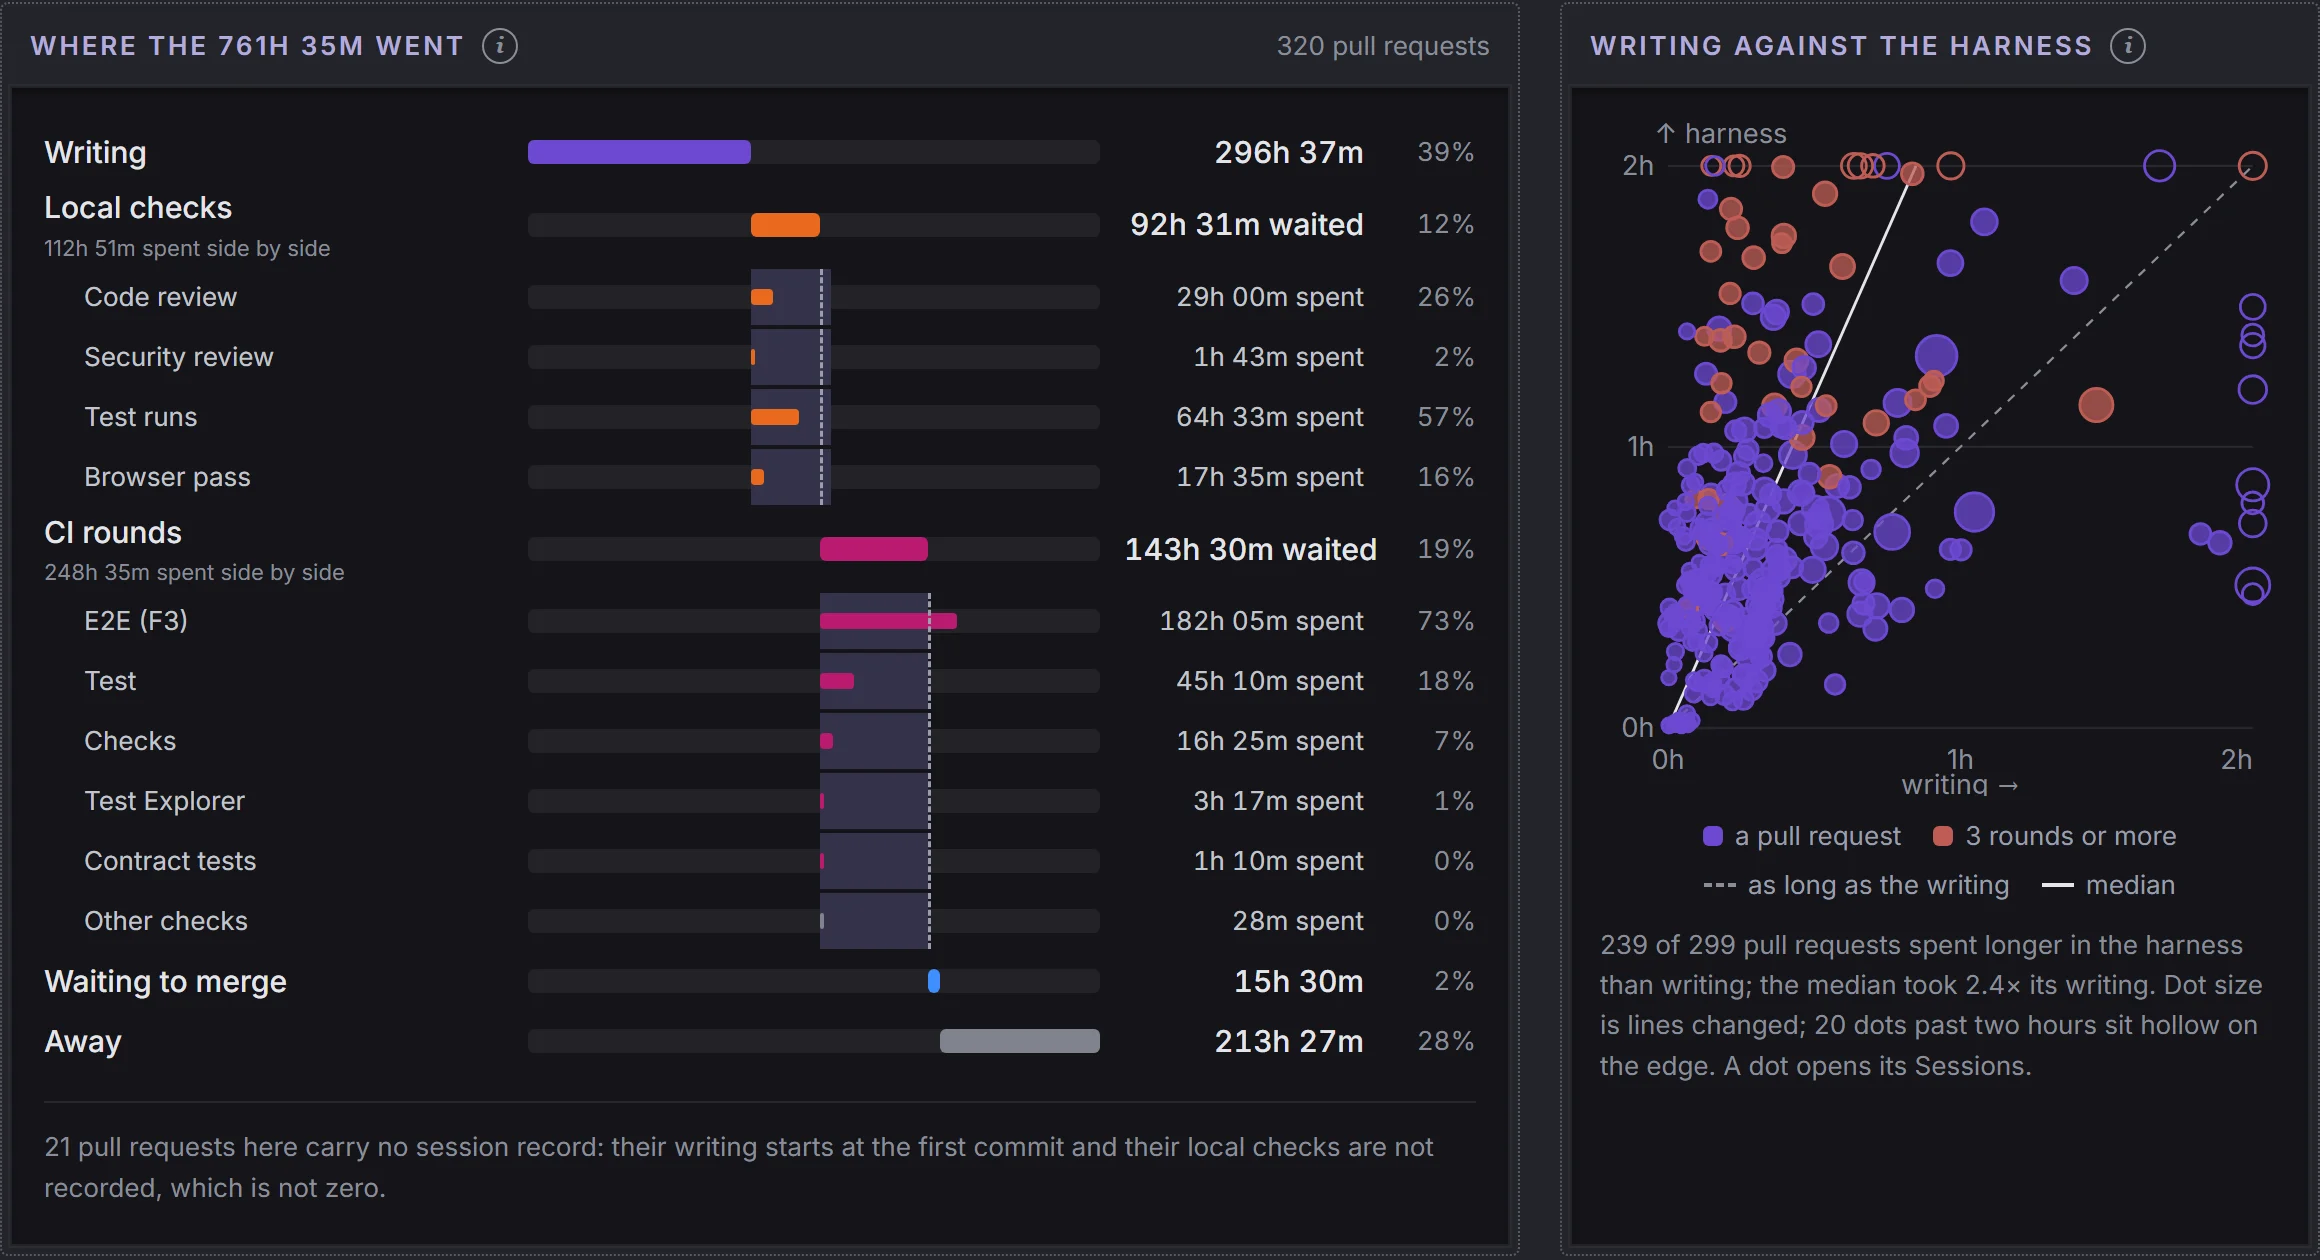
Cycle time: how long does a change take to land, and how much of that is waiting on checks rather than writing? Every merged pull request is timed from the first prompt that started it to its merge, and split into writing, local checks (code review, security review, test runs, the browser pass), CI rounds, and waiting to merge. The scatter plots writing against harness for every pull request, so you see at once whether the harness outweighs the work it checks. The totals say what to fix; one pull request says why. Open its row and you get a timeline from the first prompt to the merge, with every local check and every CI job drawn at the time it ran. How to build the report is below.
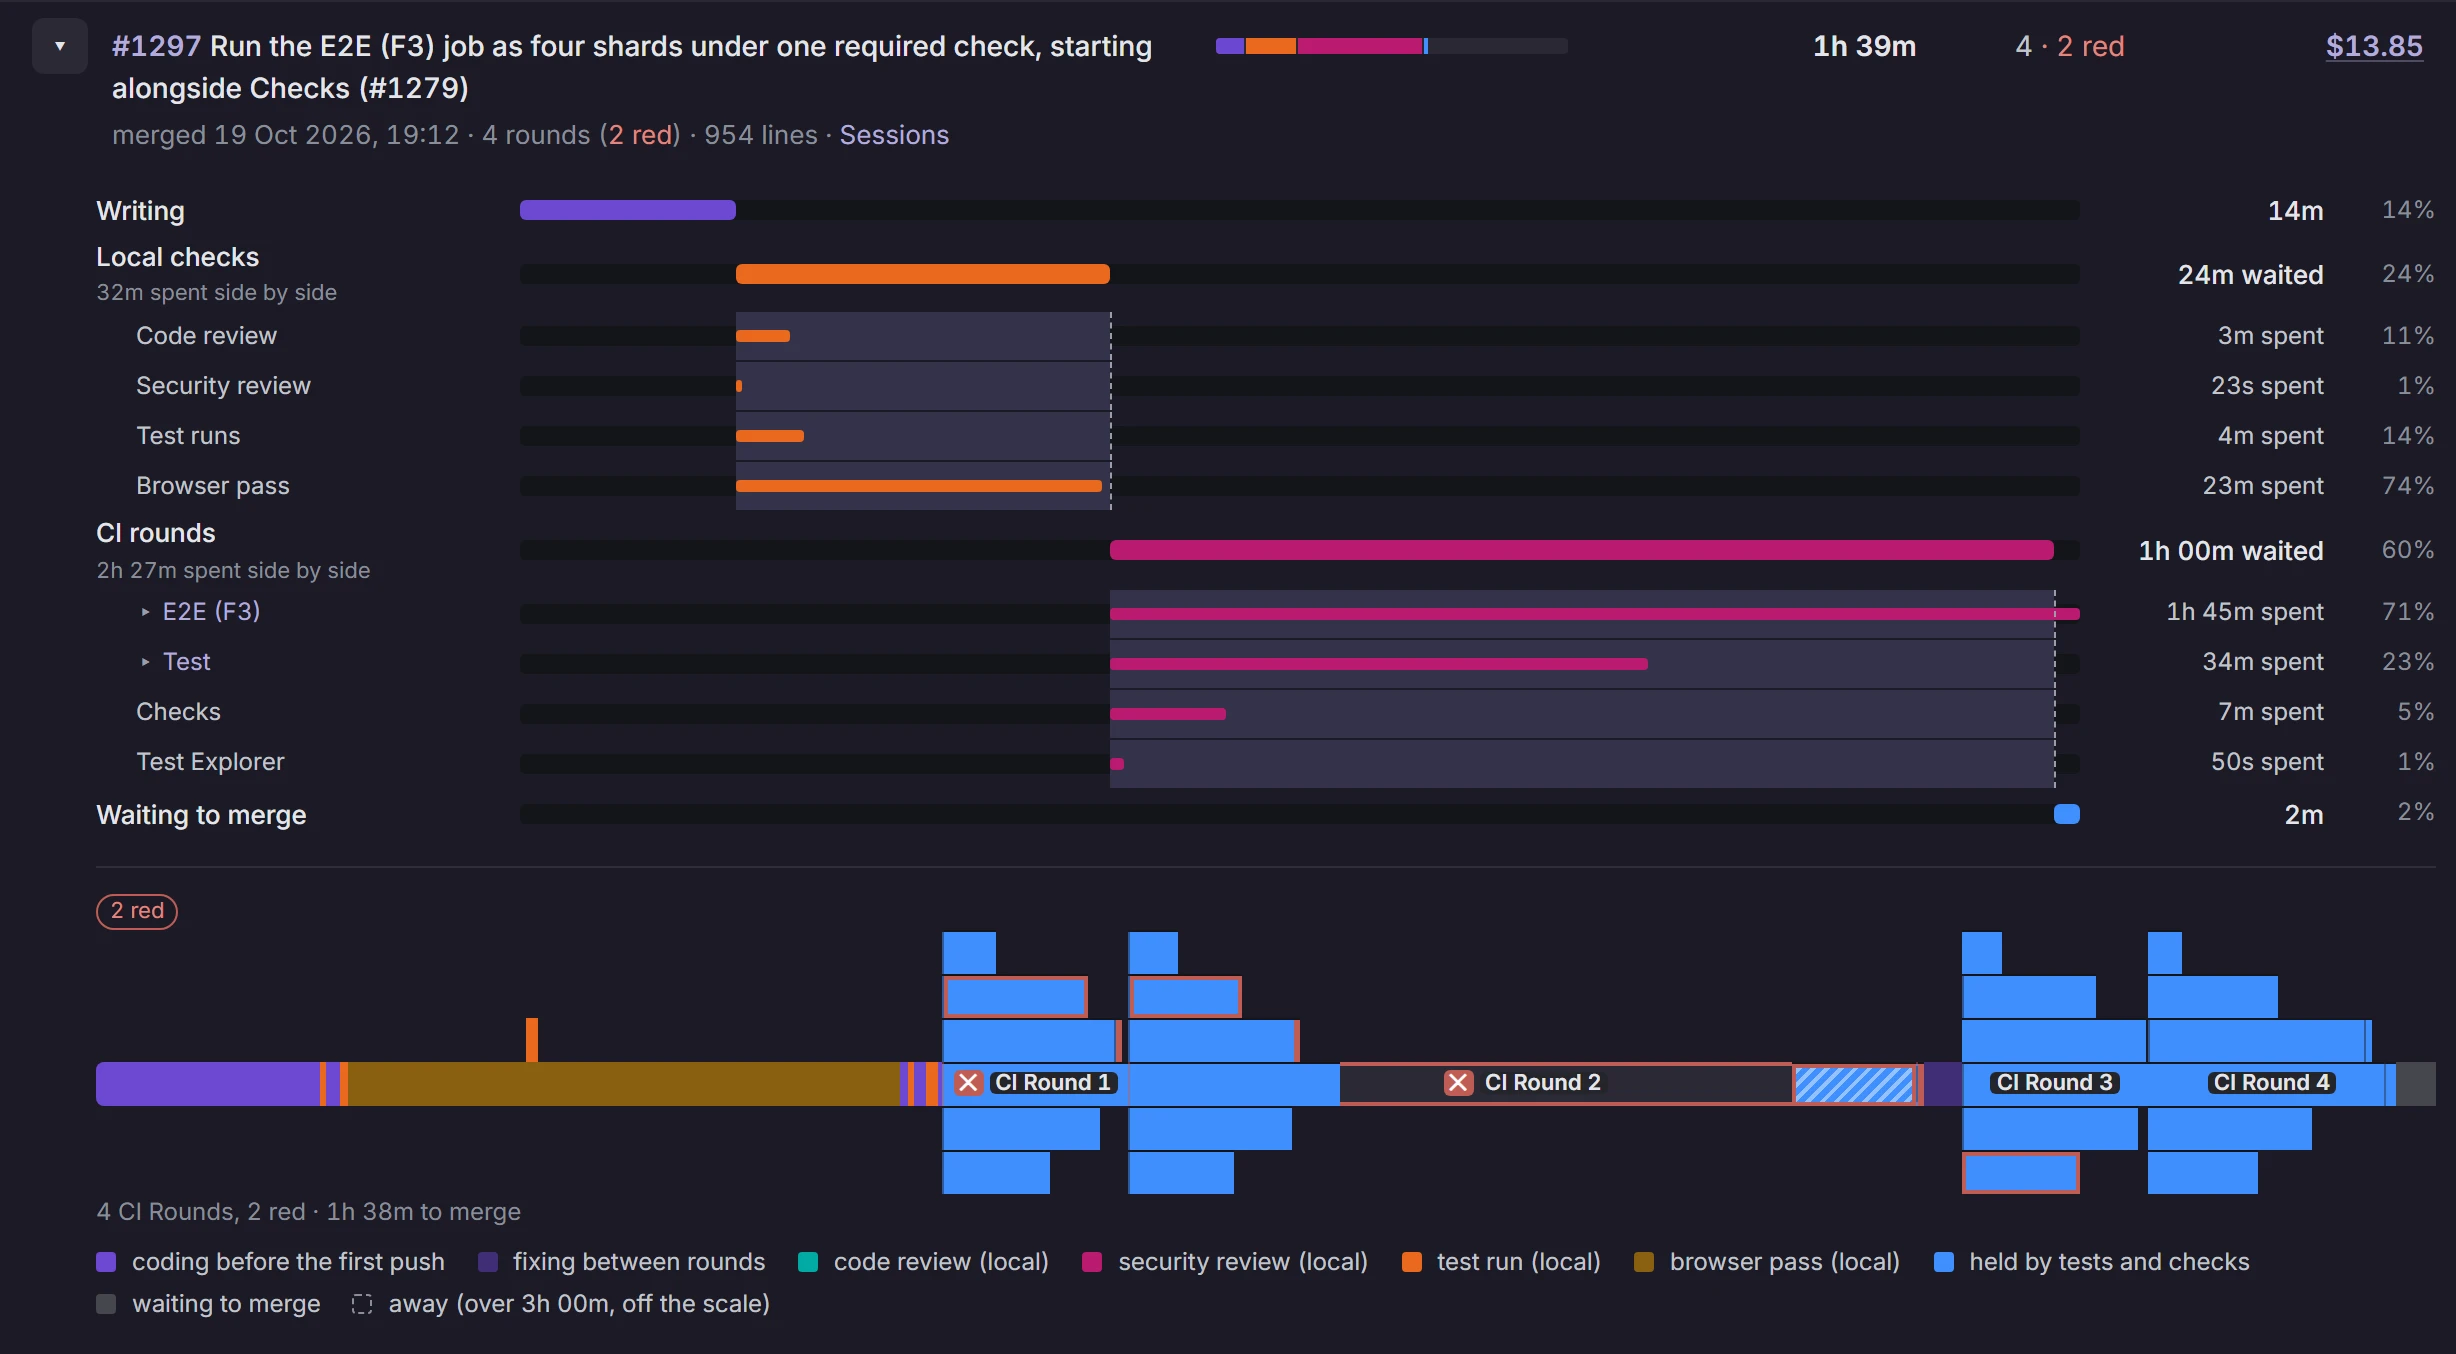
A problem only this report shows: small pull requests take as long to land as big ones, and one pull request's timeline says why. Every CI round waits for the browser-test job, which runs alone and only starts once Checks has finished, a job it doesn't depend on. What you do: split that job into shards that run side by side, and start them together with Checks.
Harness Monitor · Cycle time
The screenshot shows 239 of 299 pull requests spending longer in the harness than on writing; the median took 2.4 times its writing.
Harness Monitor · Cycle time · #1305
The screenshot shows what a pull request should look like: 23 minutes, the agent running the unit tests after nearly every edit, one push and one CI round. It is also the floor, what every pull request pays however small it is.
Harness Monitor · Cycle time · #1306
The screenshot shows a local run of the browser tests (orange, above the line) at the same time as the browser pass. The report counts the minutes they share once, so the agent is not blamed for minutes it never spent.
Harness Monitor · Cycle time · #1297
The screenshot shows 1 hour 39 minutes, of which 14 minutes of writing: two red rounds on the same shard, a re-run by hand (hatched) that failed again, and two rounds cut short by the next push. The first fixes were guesses. When a round goes red, the agent should read the failure and run that test locally before it pushes again.
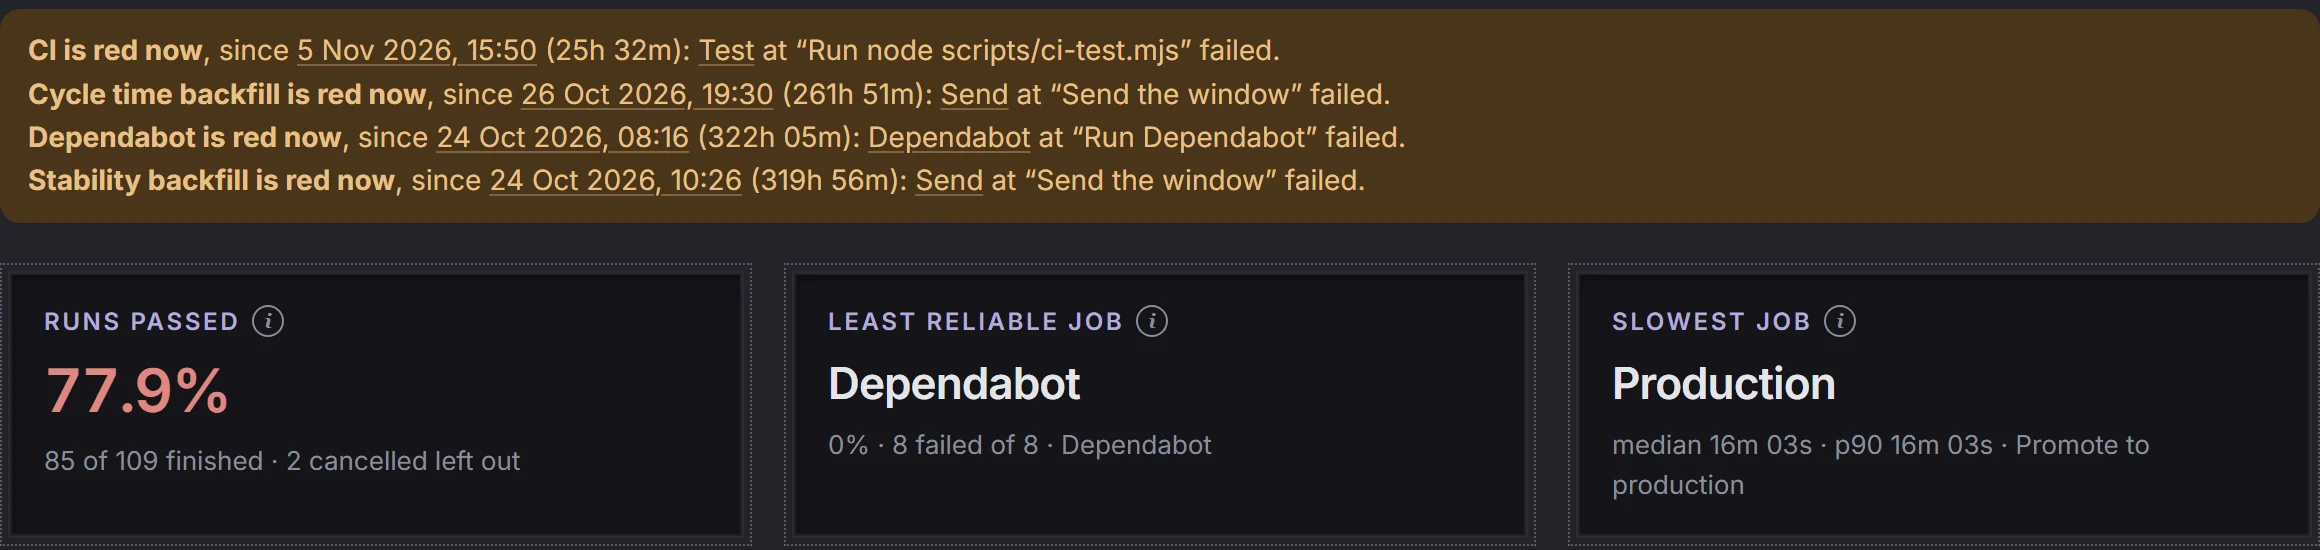
CI stability: how often do the automated checks fail, and which ones? The pass rate of every job on main, the failures that turned out to be flaky (a later attempt on the same commit passed), the tests behind them, and the slowest job. It also says which workflows are red right now, and since when.
A problem only this report shows: one browser test fails about one run in ten and passes when it is re-run. Each time, a pull request pays for a CI round that nobody's code caused. Cycle time only shows the extra rounds; this report names the test. What you do: fix that test, or take it out of the required checks until it is fixed, before you add new ones.
Harness Monitor · CI stability
The screenshot shows four workflows that are red, one of them for almost two weeks, and 77.9% of runs passing over the last seven days.
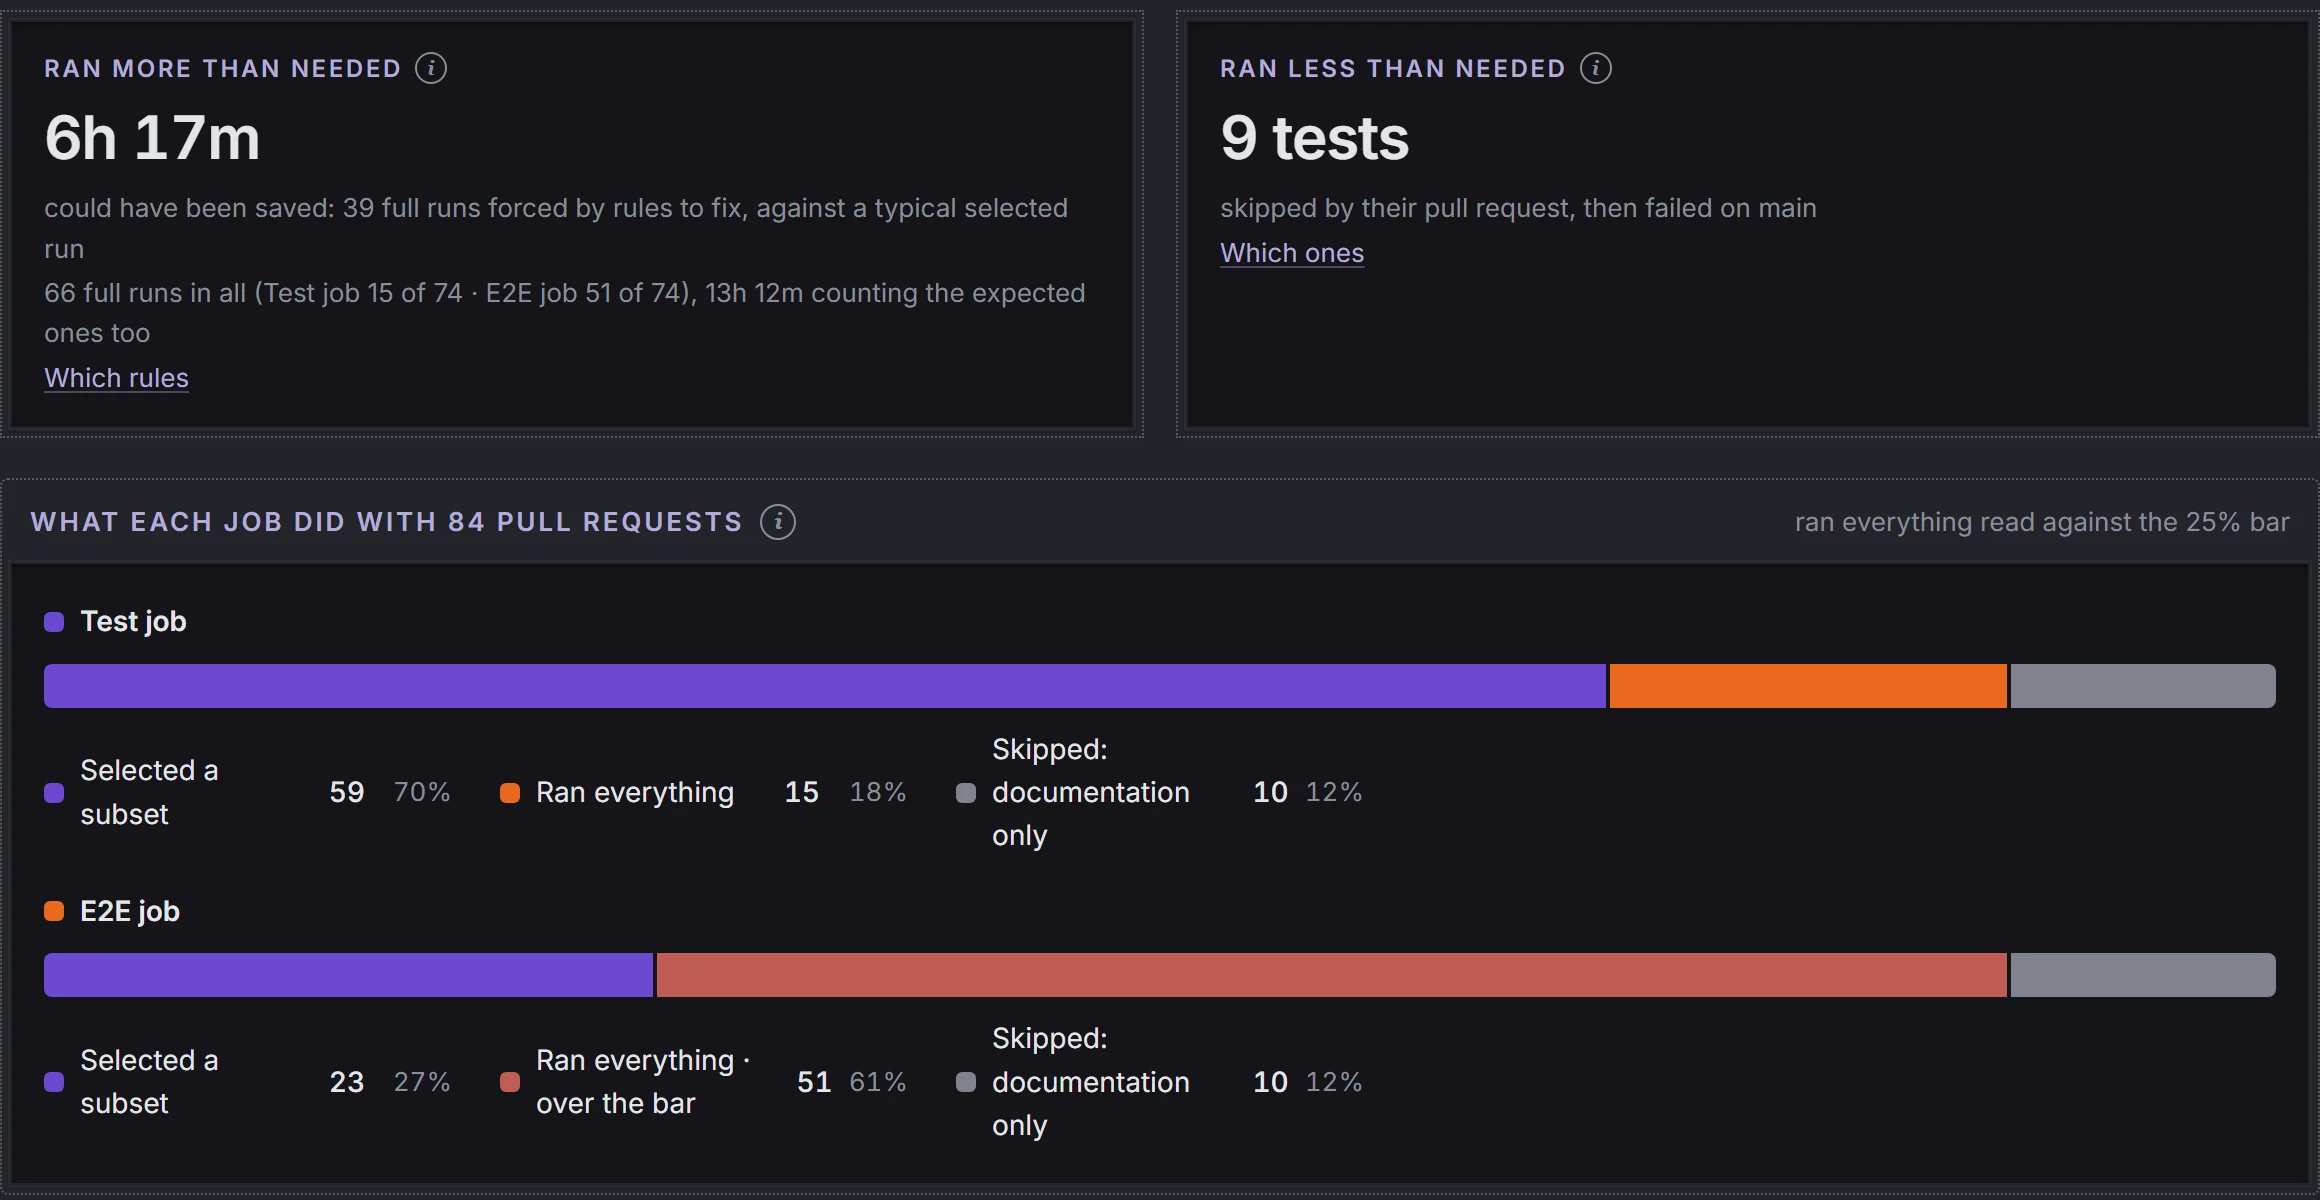
Test selection: does CI run only the tests a change can affect? For every merged pull request, whether each test job ran only the tests the change can reach or was forced to run everything, which rule forced it, and which tests a pull request skipped that then failed on main. Too wide wastes time on every change; too narrow lets a broken test through. How Cockpit selects its tests is in Managing test automation.
A problem only this report shows: a one-line edit to a shared helper file makes the browser-test job run the whole suite, because a selection rule maps that file to every test. Cycle time shows a slow round; this report names the rule that forced it and the time it cost. What you do: narrow that rule, so the file maps only to the tests that use it.
Harness Monitor · Test selection
The screenshot shows the browser test job running everything on 61% of pull requests, far above its 25% bar, and nine tests that were skipped and then failed on main.
Claude Code costs: what does building with Claude Code cost, and where does the money go? Every request on the repository, priced at Anthropic's API list price whatever plan paid for it, and split by the phase it was made in: scoping and planning, building, the local reviews, and the work after the push. How every token is tied to a pull request, and what that showed me, is on the Cost page.
A problem only this report shows: the work after the push costs almost as much as the building, because the session stays open while it waits on CI and fixes red rounds. Cycle time counts those minutes, not the tokens they burn. What you do: catch more before the push, for example by running locally the kind of test that most often goes red in CI, so fewer rounds need fixing.
Harness Monitor · Claude Code costs
The screenshot shows where a month of spend went: after building and scoping, the work after the push is the largest share.
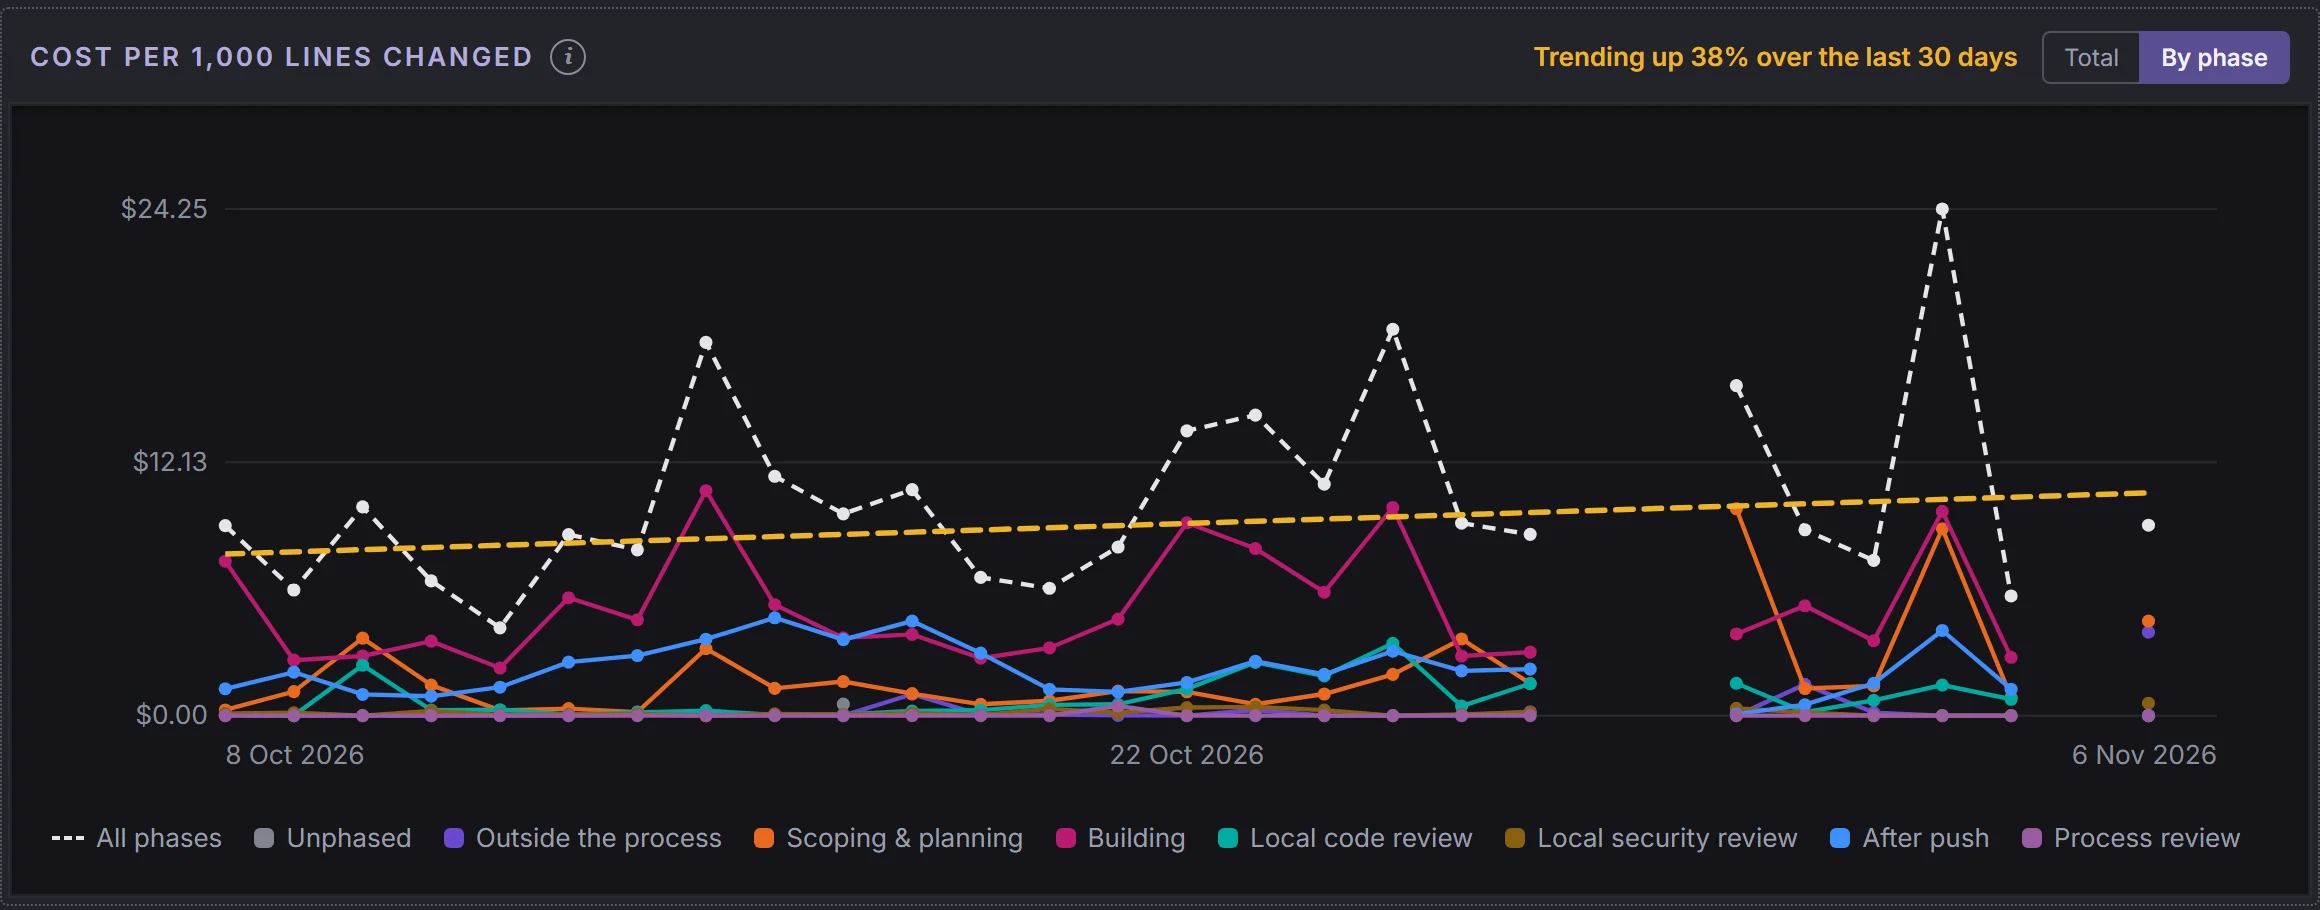
Harness trend: is the harness getting more expensive? Three lines over time: how much context a session starts with, how big a pull request is, and what 1,000 changed lines cost, each with its trend. A harness rarely gets expensive in one step. It creeps, one rule or one check at a time, and this is where you see it.
A problem only this report shows: the context a session starts with grows a little every week, as rules land in files every session loads. No single pull request looks expensive, so no other report flags it; only the line over time does. What you do: move the rules that only one step needs out of the always-loaded files and into the skill for that step.
Harness Monitor · Harness trend
The screenshot shows the cost per 1,000 lines changed trending up 38% over 30 days.
Build the cycle-time report
The CI side was always there: GitHub keeps every job's times. What happens on the agent's machine, nobody writes down unless you make the agent do it. In Cockpit the report takes these steps.
Run every change through one skill, and make it mark the start and end of each step. The timings only compare when every change goes through the same steps. In Cockpit that is /build, which tells the agent to run a small script at each boundary, such as node scripts/session-record.mjs mark browser-start before it starts the app and mark browser-end once the walk is written. The script reads the clock itself, so the agent can't guess a time or back-date one. Why one skill runs every step is in Automating the build.
Let the test runners record their own runs. The agent runs the tests dozens of times, and nobody marks those by hand. Every test configuration lists a small reporter (Vitest, Playwright, Node) that appends each run's start, end and what it ran to the same file. Those are the short test runs on the timelines above.
Keep the record on the pull request. After every push, the skill copies the file into a block at the end of the pull request's description, so GitHub stores it with everything else. This is the block of #1305, cut short: first the agent's marks, then the test runners' own lines.
Read the CI side from GitHub, job by job. For every job GitHub keeps when it was created, when a runner picked it up, when it finished and how it ended. Ask for the job list with every attempt included, and a re-run arrives as a second attempt of the same job. Cockpit's cycle-time tool reads that with each pull request's record and cuts it into phases; its README explains each rule, such as what counts as a push, a round or a fluke.
Send it to the Monitor every night, and let the Monitor draw it. A nightly job runs the tool and sends the merged pull requests to the Harness Monitor, which keeps them longer than GitHub does and draws the pages. One file says what each panel shows and how to read it.
Or hand it to your agent. Point it at Cockpit with a prompt like this:
I want a report that shows where the time goes between starting a change and merging it, so I know what to speed up in my harness. Use https://github.com/michaelvanhoutte/cockpit as the example: .claude/commands/build.md, scripts/session-record.mjs, scripts/lib/vitest-session-reporter.mjs, tools/cycle-time, apps/harness-monitor and .github/workflows/nightly.yml.

First, check whether every change in this repository goes through one skill or command that runs all the steps. If it doesn't, stop and tell me, because the timings depend on it.

Then propose a plan, before writing any code, to:
1. Add a script that appends a step and the current time to a file for the branch. The script reads the clock itself.
2. Make the skill run it at the start and at the end of each review and of the browser pass, and right before each push.
3. Add a reporter to every test configuration that appends each run's start, end and scope to the same file, so the agent never marks a test run by hand.
4. Copy that file into the pull request description after every push.
5. Write a script that reads the merged pull requests, their records and every CI job of every run, including re-runs and cancelled jobs, and cuts each pull request into writing, local checks, CI rounds, waiting to merge and time away.
6. Show all pull requests added together by phase, a scatter of writing against harness time, and a timeline per pull request with each local check and each CI job at the time it ran.
7. Run that script every night and publish the page.
Review it every month: /harness-cost-review
Reports only help if someone reads them, and nobody reads five reports every week. Once a month, one skill reads them for you, decides which numbers point at a real cause, and files a ticket for each one. A person still decides what to do about it.
Run /harness-cost-review once a month, and let it file one ticket per cause. It reads the Monitor's answers for cycle time, test selection and CI stability, and the token cost per ticket, then files one ticket per cause with the numbers behind it. Monthly is enough: cycle time and cost move slowly, and the test selection report raises its own alarm every night.
Name the cause, not only the symptom. A slow cycle time can come from slices that are too small, from avoidable CI rounds, from a job that grew slower, or from tests that run too much, and each needs a different fix. Cockpit's skill applies one bar per cause, such as the harness taking longer than the coding on most pull requests, or a test job forced to run everything on a quarter of them.
Never let the review remove a check itself.It files the evidence for a person to decide, and a check that rarely fails is never a candidate: it is guarding code that is rarely broken.
Treat a report nobody can read as a finding. A report that stopped updating looks the same as a quiet harness. Cockpit's skill files it as a cause of its own when a report is missing or its newest data is more than two days old: a report nobody can read is a report nobody is watching.



 Conselit