Cockpit

A product I build and run myself, in production, so that what I say about building software is something I have done. I build it with the process I describe in Agentic Development: agents write all of its code, and a harness of tests, reviews and checks decides what gets merged.

No account needed for production: choose "Continue as guest" to try a demo account. It resets every night.

The product

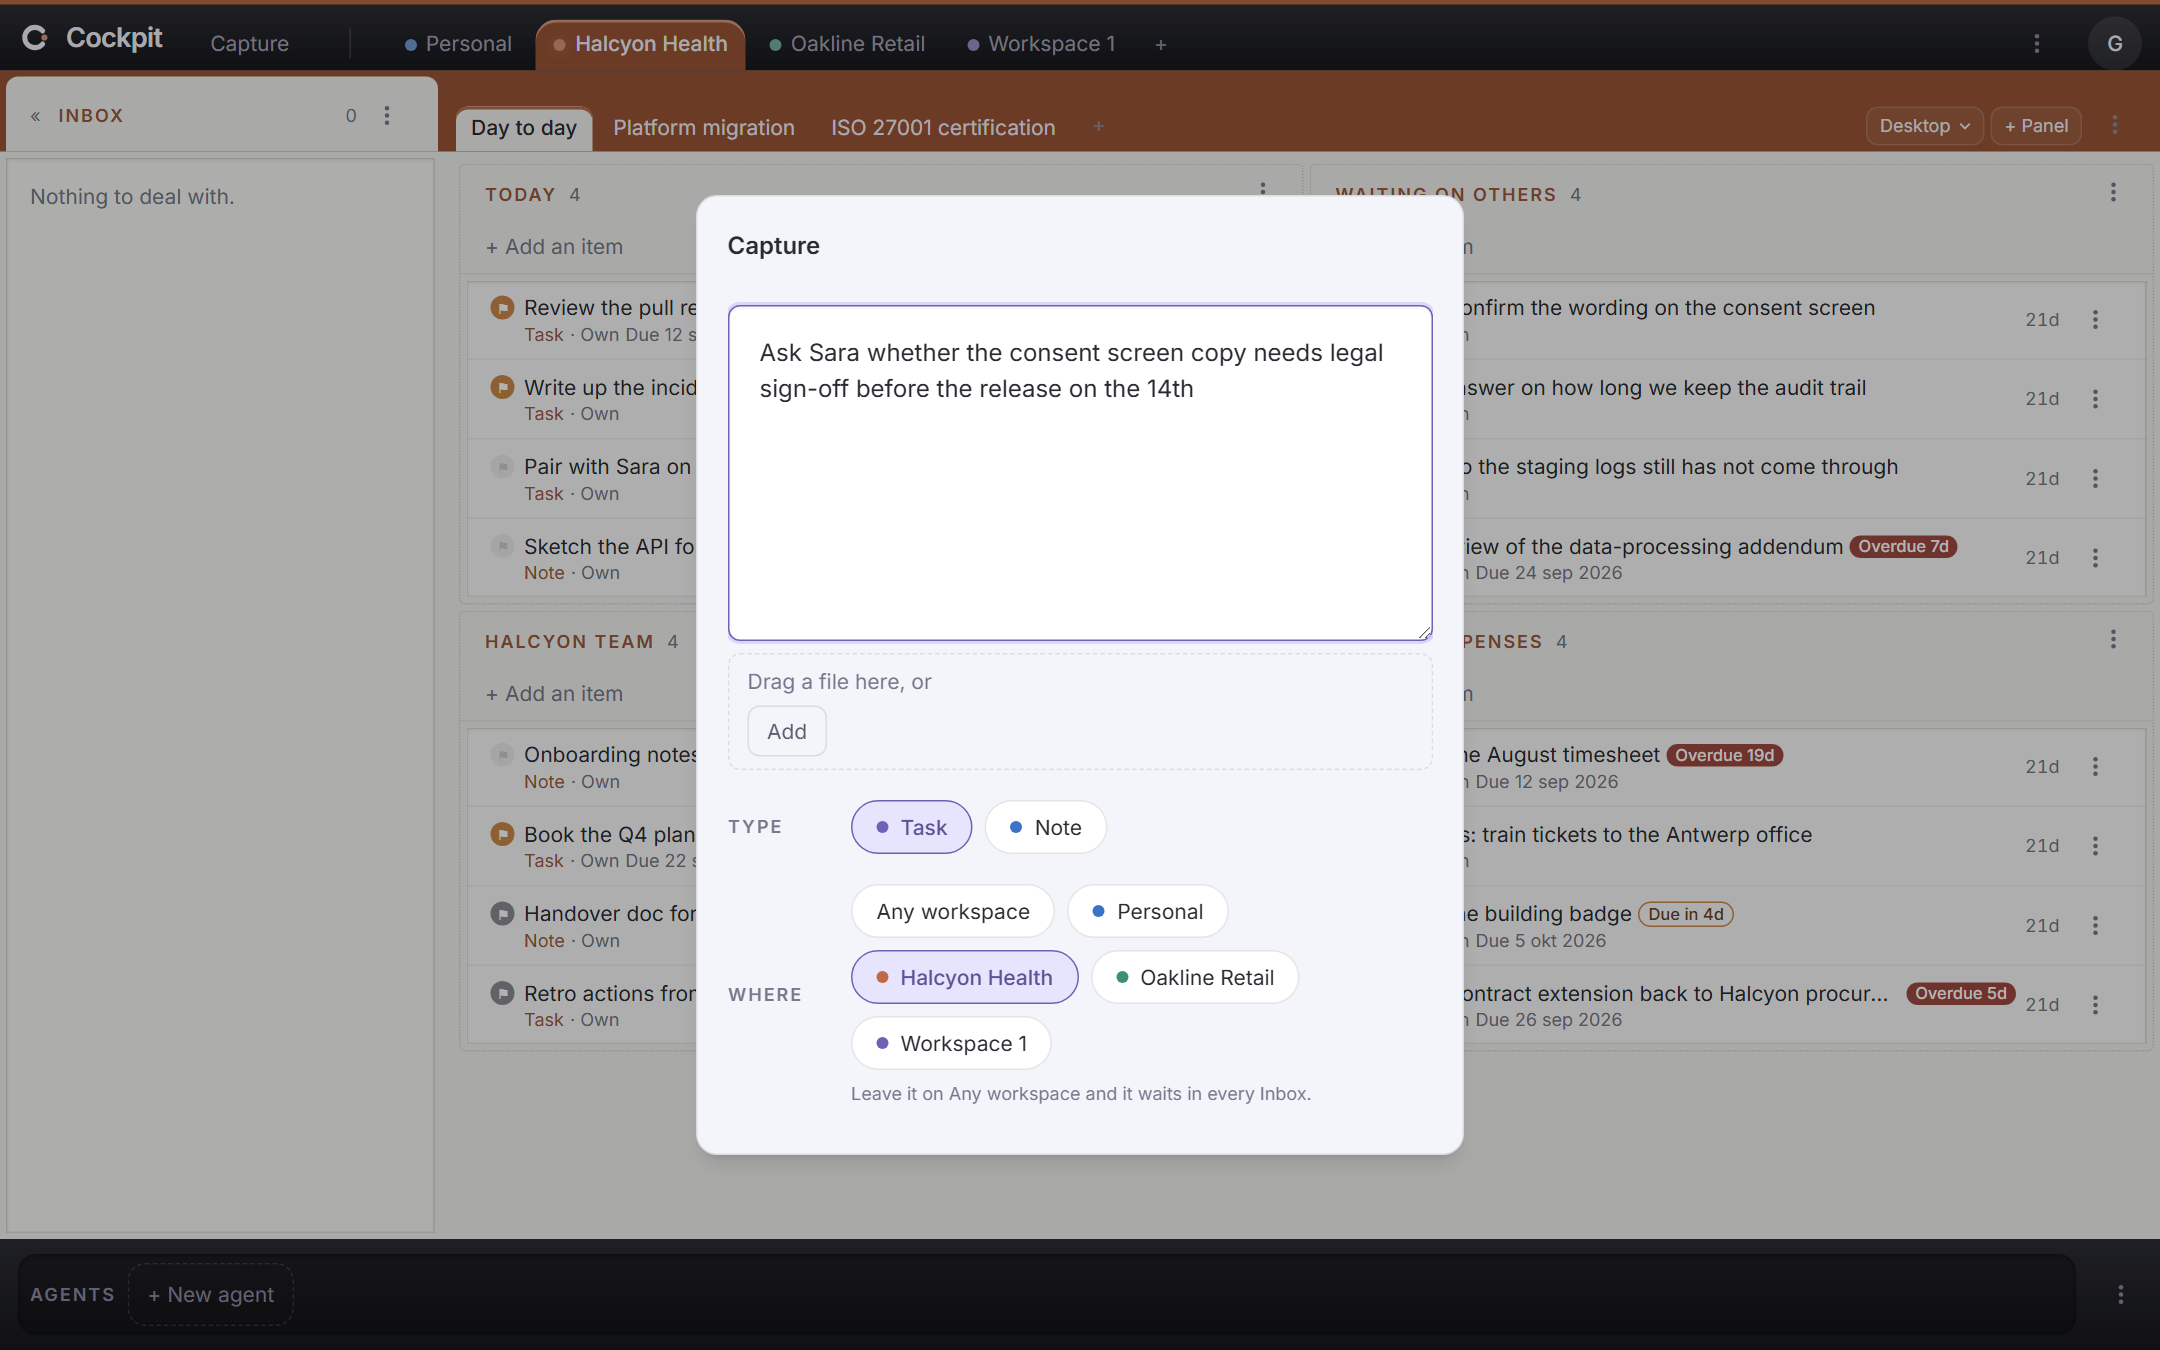
A personal inbox and dashboard for everything that needs my follow-up. The goal is one list of everything: items flagged for me in Notion, Teams, Slack, Linear and other apps, which show up by themselves, together with anything I capture wherever I am, on my phone, at my desk or by voice while driving. Agents then process those items for me.
Why I built it

Two reasons. The first is a problem I had. My overview of what to follow up on was a Notion board I filled in by hand, so a Slack message only counted once I had copied it there. Sorting cost too much effort, so the board became one long pile. Labels like "today" stayed on items long after the day had passed, and things got lost.

The second is that I wanted to build a whole product agentically, not read about it. Cockpit is greenfield and in production, written by agents from the first commit while I steer the design, the tests and the checks. The convictions on this site come from that, and where one does, it links to the real file or command in the repository.

What it does

Things I have to follow up on land in many apps: flagged email, Slack messages, Notion comments and actions. Cockpit collects them in one place, on dashboards made of movable panels, organised by project, person, topic and priority.

A second step adds an inbox. Everything new arrives there as something to deal with, and you read it, answer it or flag it for later. Flagging feeds the dashboards.

Items can also be handed to agents. My agents sit in a dock at the bottom of the screen, and I drag one onto an item to start a Claude Code session on it. For example, I drop my "Scope in Cockpit" agent on an idea, it starts scoping, and I follow up with it in Claude.

  • Installable web app for phone and desktop.
  • Sign in with a Google account.
  • Keeps a local copy, so it opens fast.
The harness and its reports

Agents write the code, so the harness decides whether a change is good enough to merge: the tests, the reviews, the checks and the rules about architecture. I can only trust and improve a harness I can see, so each part of it publishes a report, rebuilt from the repository.

When you start with agentic development, you run into questions like the ones below. Each report answers one of them. All of them are live: open one and look at today's numbers, not a screenshot.

Speed and cost

Cycle time

Why does a small change take my agents so long?

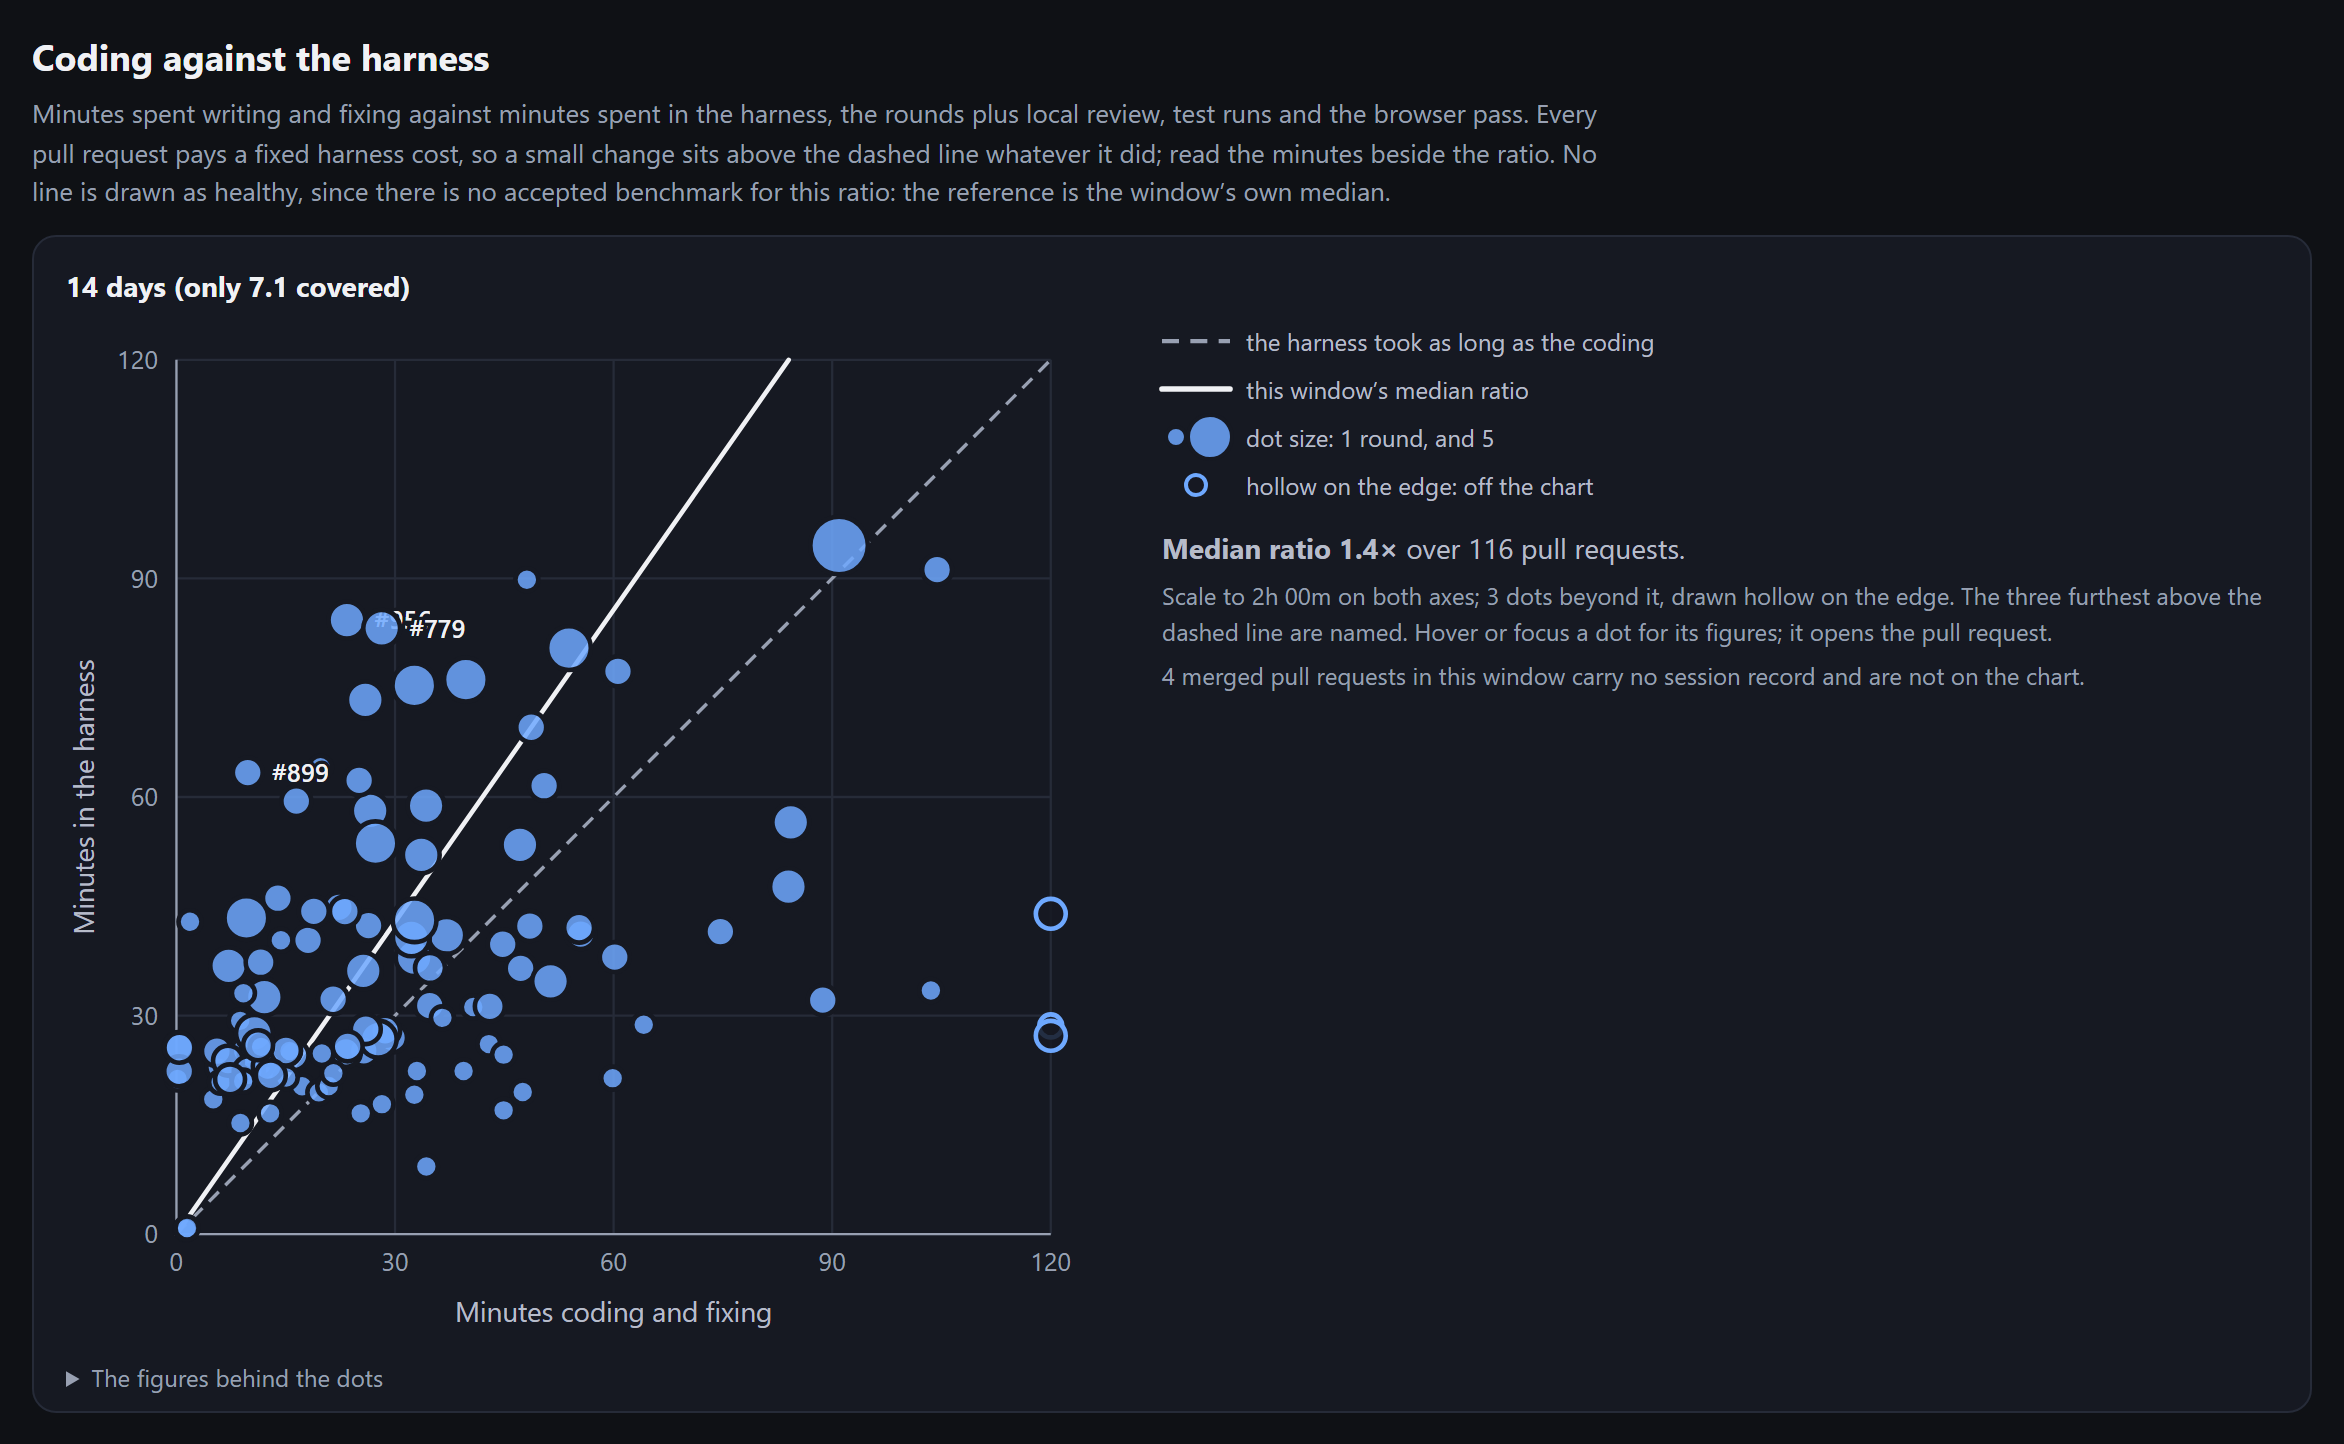
Coding against the harness: one dot per merged pull request, minutes spent coding and fixing against minutes spent in the harness, with a dashed line where the two are equal and a solid line at the median ratio of 1.4.
On 12 October 2026

For the median change, the harness took 1.4 times as long as writing and fixing the code, over 116 pull requests.

Every dot is one merged pull request: the minutes spent writing and fixing the code against the minutes spent in the harness, which means the review rounds, the test runs and the browser pass. Bigger dots needed more rounds. Every pull request pays a fixed harness cost, so a small change sits above the dashed line whatever it did.

Below the chart, every pull request is listed with its rounds and how long it took to merge.

Claude Code costs

What are the agents costing me, and on what?

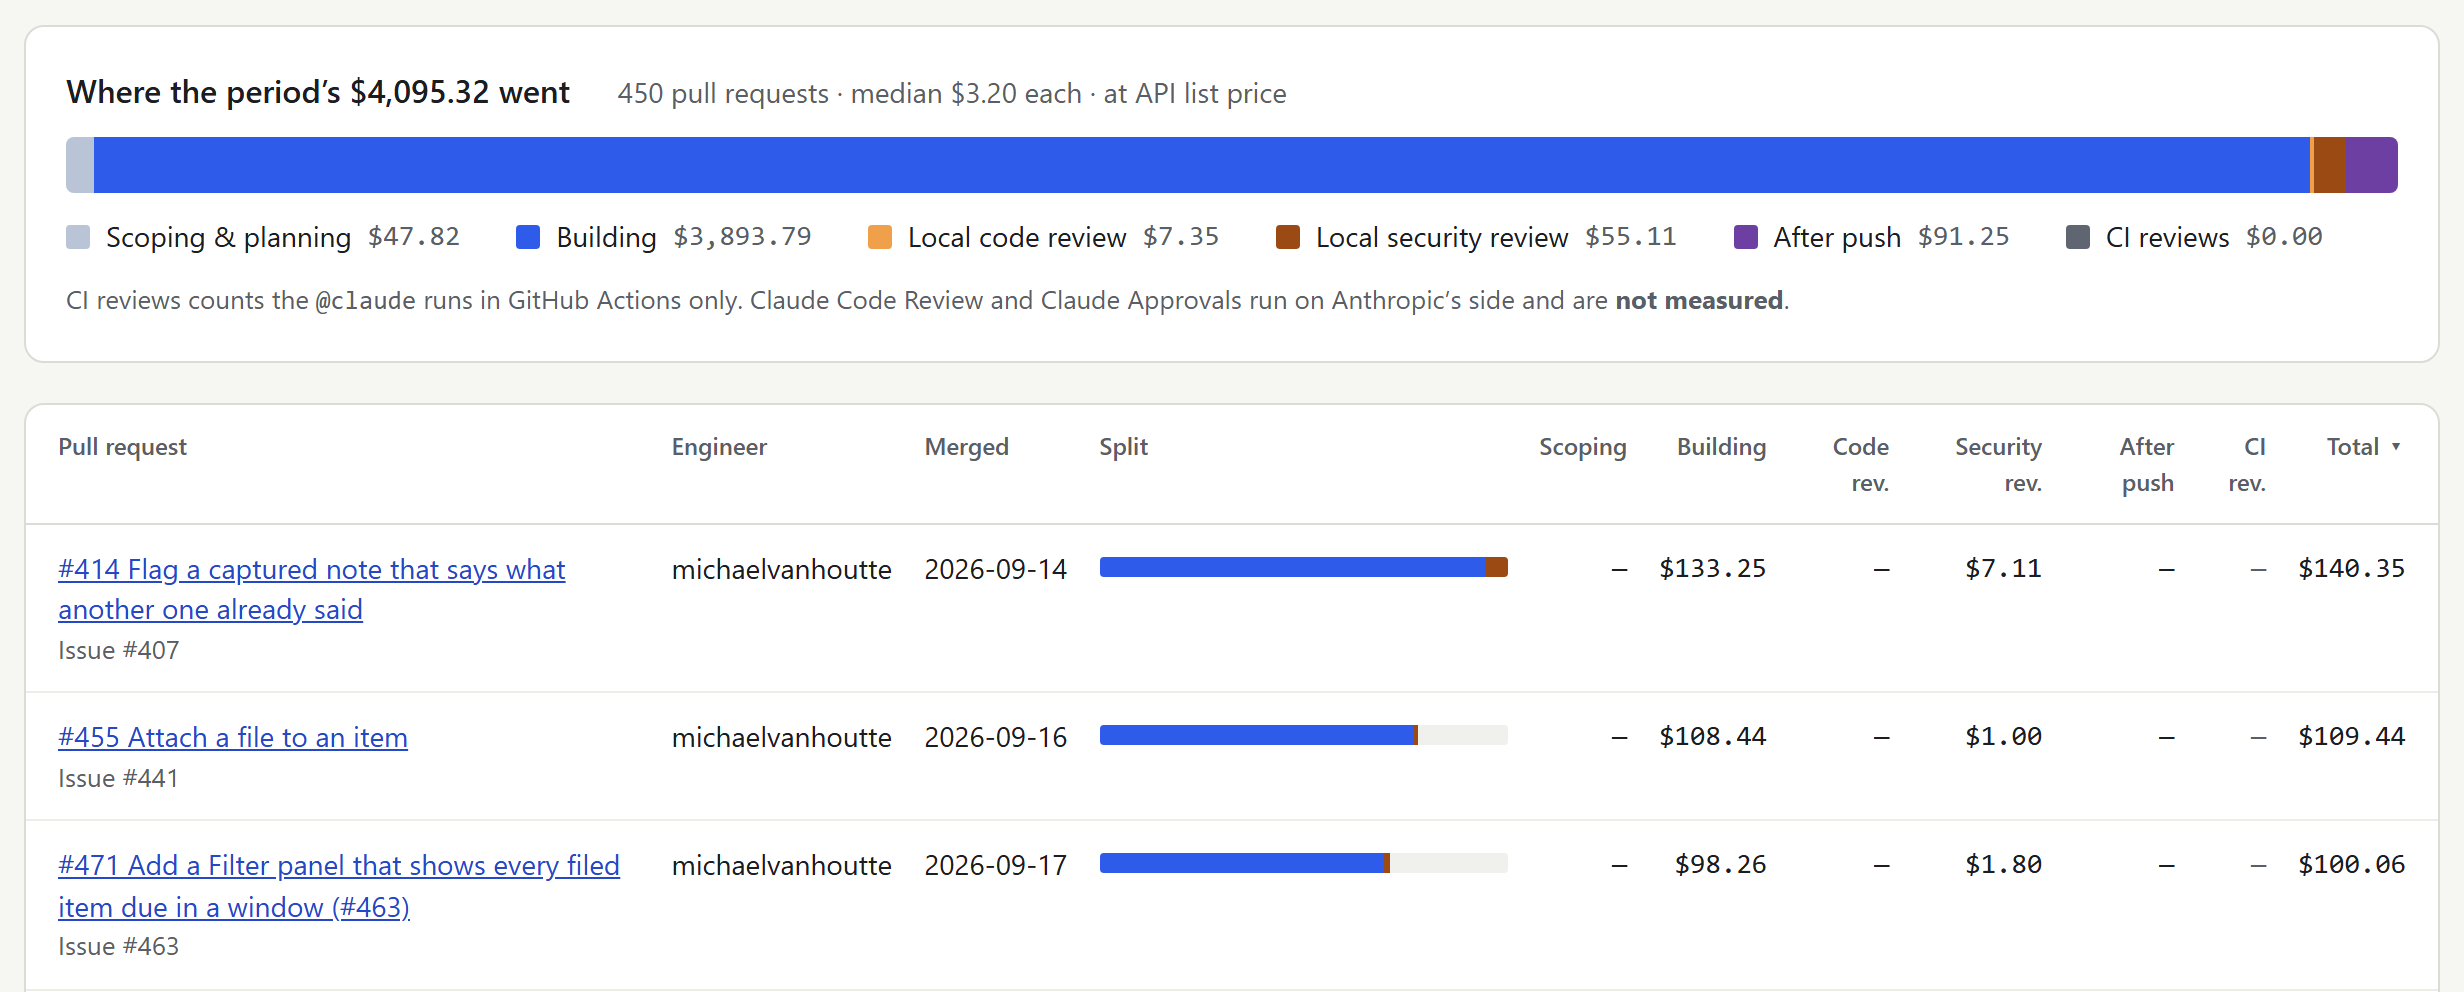
Claude Code costs for the last 30 days: one bar splitting $4,095.32 over scoping and planning, building, local code review, local security review, after push and CI reviews, and below it the three most expensive pull requests with their cost per step.
Last 30 days, on 12 October 2026

$4,095 over 450 pull requests, a median of $3.20 each, at API list price. Building is $3,894 of it. The local reviews cost $62 together.

Every Claude Code session is recorded and tied to its pull request and issue. The report splits the cost by step: scoping and planning, building, local code review, local security review, after push and the reviews in CI. It can group by pull request, issue, engineer, step or day, and export to CSV.

So I see which changes were expensive and which step made them expensive. The most expensive one in the screenshot cost $140, almost all of it building. One gap the report states itself: Claude Code Review and Claude Approvals run on Anthropic's side, so they are not in it.

Trusting the tests

CI stability

CI is red. Is something broken, or is it a flaky test again?

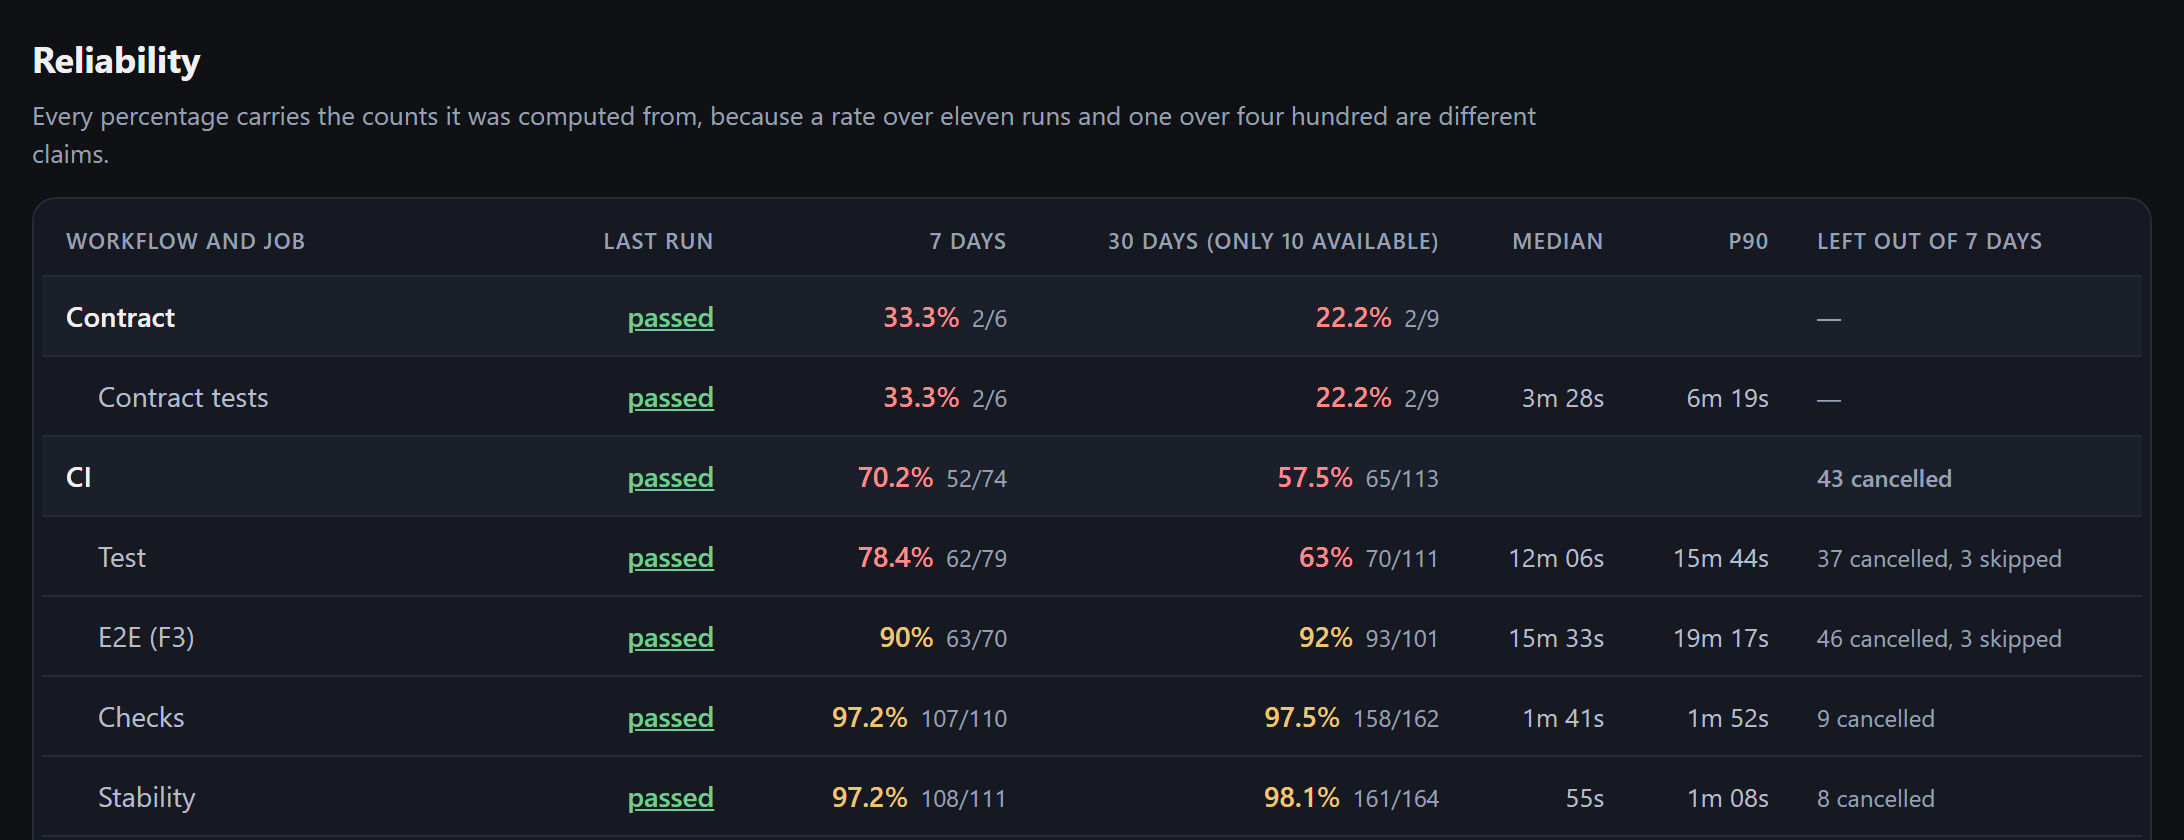
CI stability: pass rate per workflow and job over 7 and 30 days with the run counts behind each, worst first. The contract tests passed 2 of 6 runs this week, the Test job 62 of 79.
7 days to 12 October 2026

The contract tests passed 2 of their 6 finished runs, and the Test job 62 of 79. Main stayed red on the contract tests for almost 123 hours.

Every CI job's pass rate over 7 and 30 days, with the run counts it comes from and how long the job takes, worst first. A cancelled run is left out of the rate and counted on its own. So I see quickly when a check has become unstable and needs fixing.

Test selection

The agents write so many tests. How do I keep CI fast?

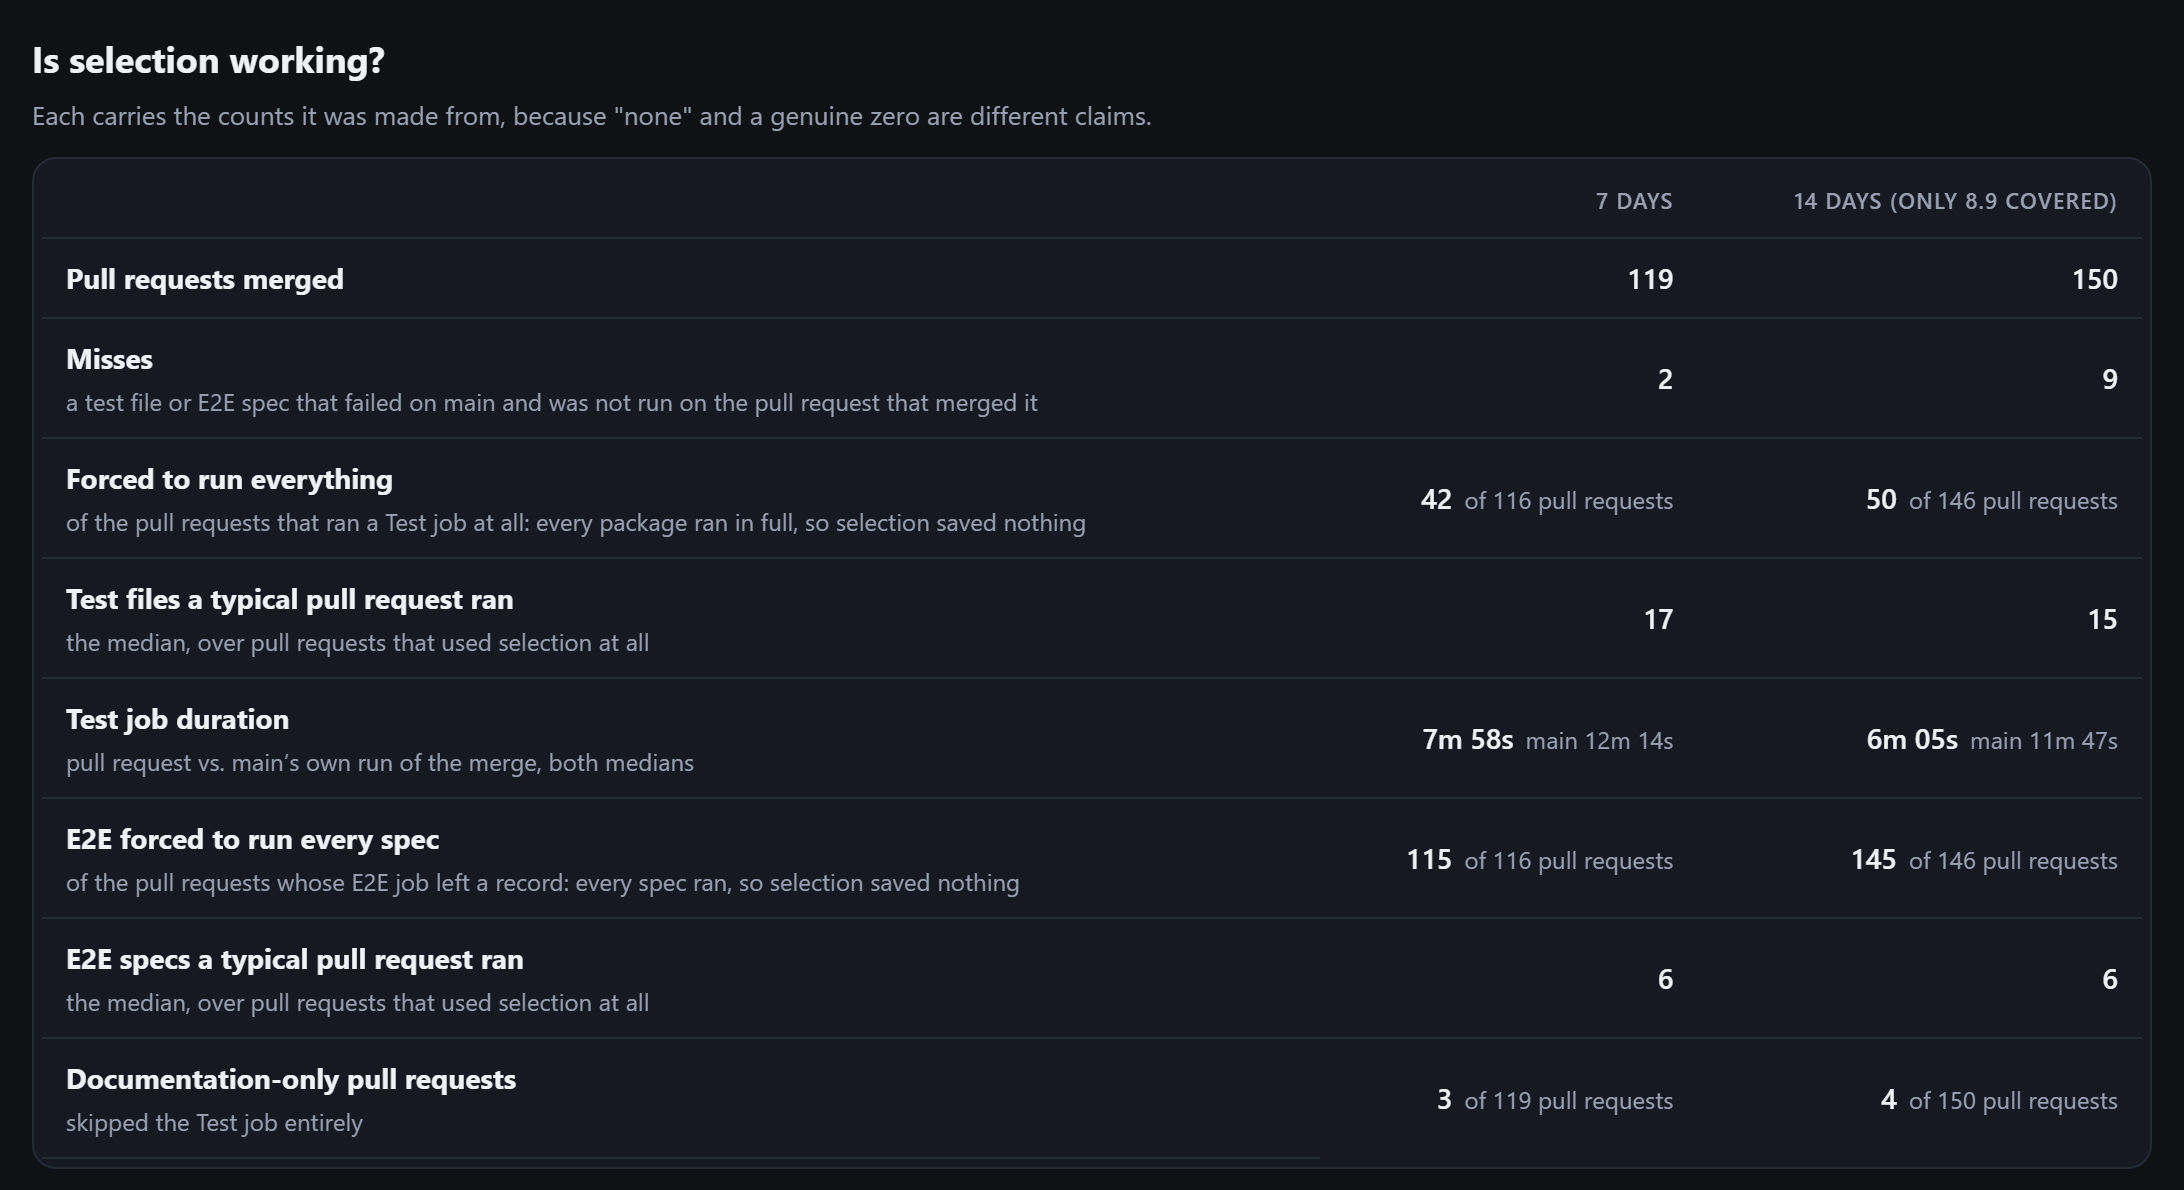
Is selection working: over 7 days, 119 pull requests merged, 2 misses, 42 of 116 forced to run everything, a median Test job of 7m 58s against 12m 14s on main, and 115 of 116 pull requests running every browser spec.
Last 7 days, on 12 October 2026

Selection cut the Test job from 12m 14s on main to 7m 58s on a pull request, and missed 2 tests that later failed on main. The browser tests still ran every spec on 115 of 116 pull requests, so there it saves nothing yet.

CI runs only the tests a change can affect. Without that, every change would run the whole suite, which would be far too slow and too expensive. This report shows whether the selection works: how often it misses a test, how often it is forced to run everything, and how much time it saves.

When the harness feels slow, I open a pull request here and see which tests ran and the chain of imports that made each one run.

Test coverage

I don't write the tests myself. How do I know what is tested?

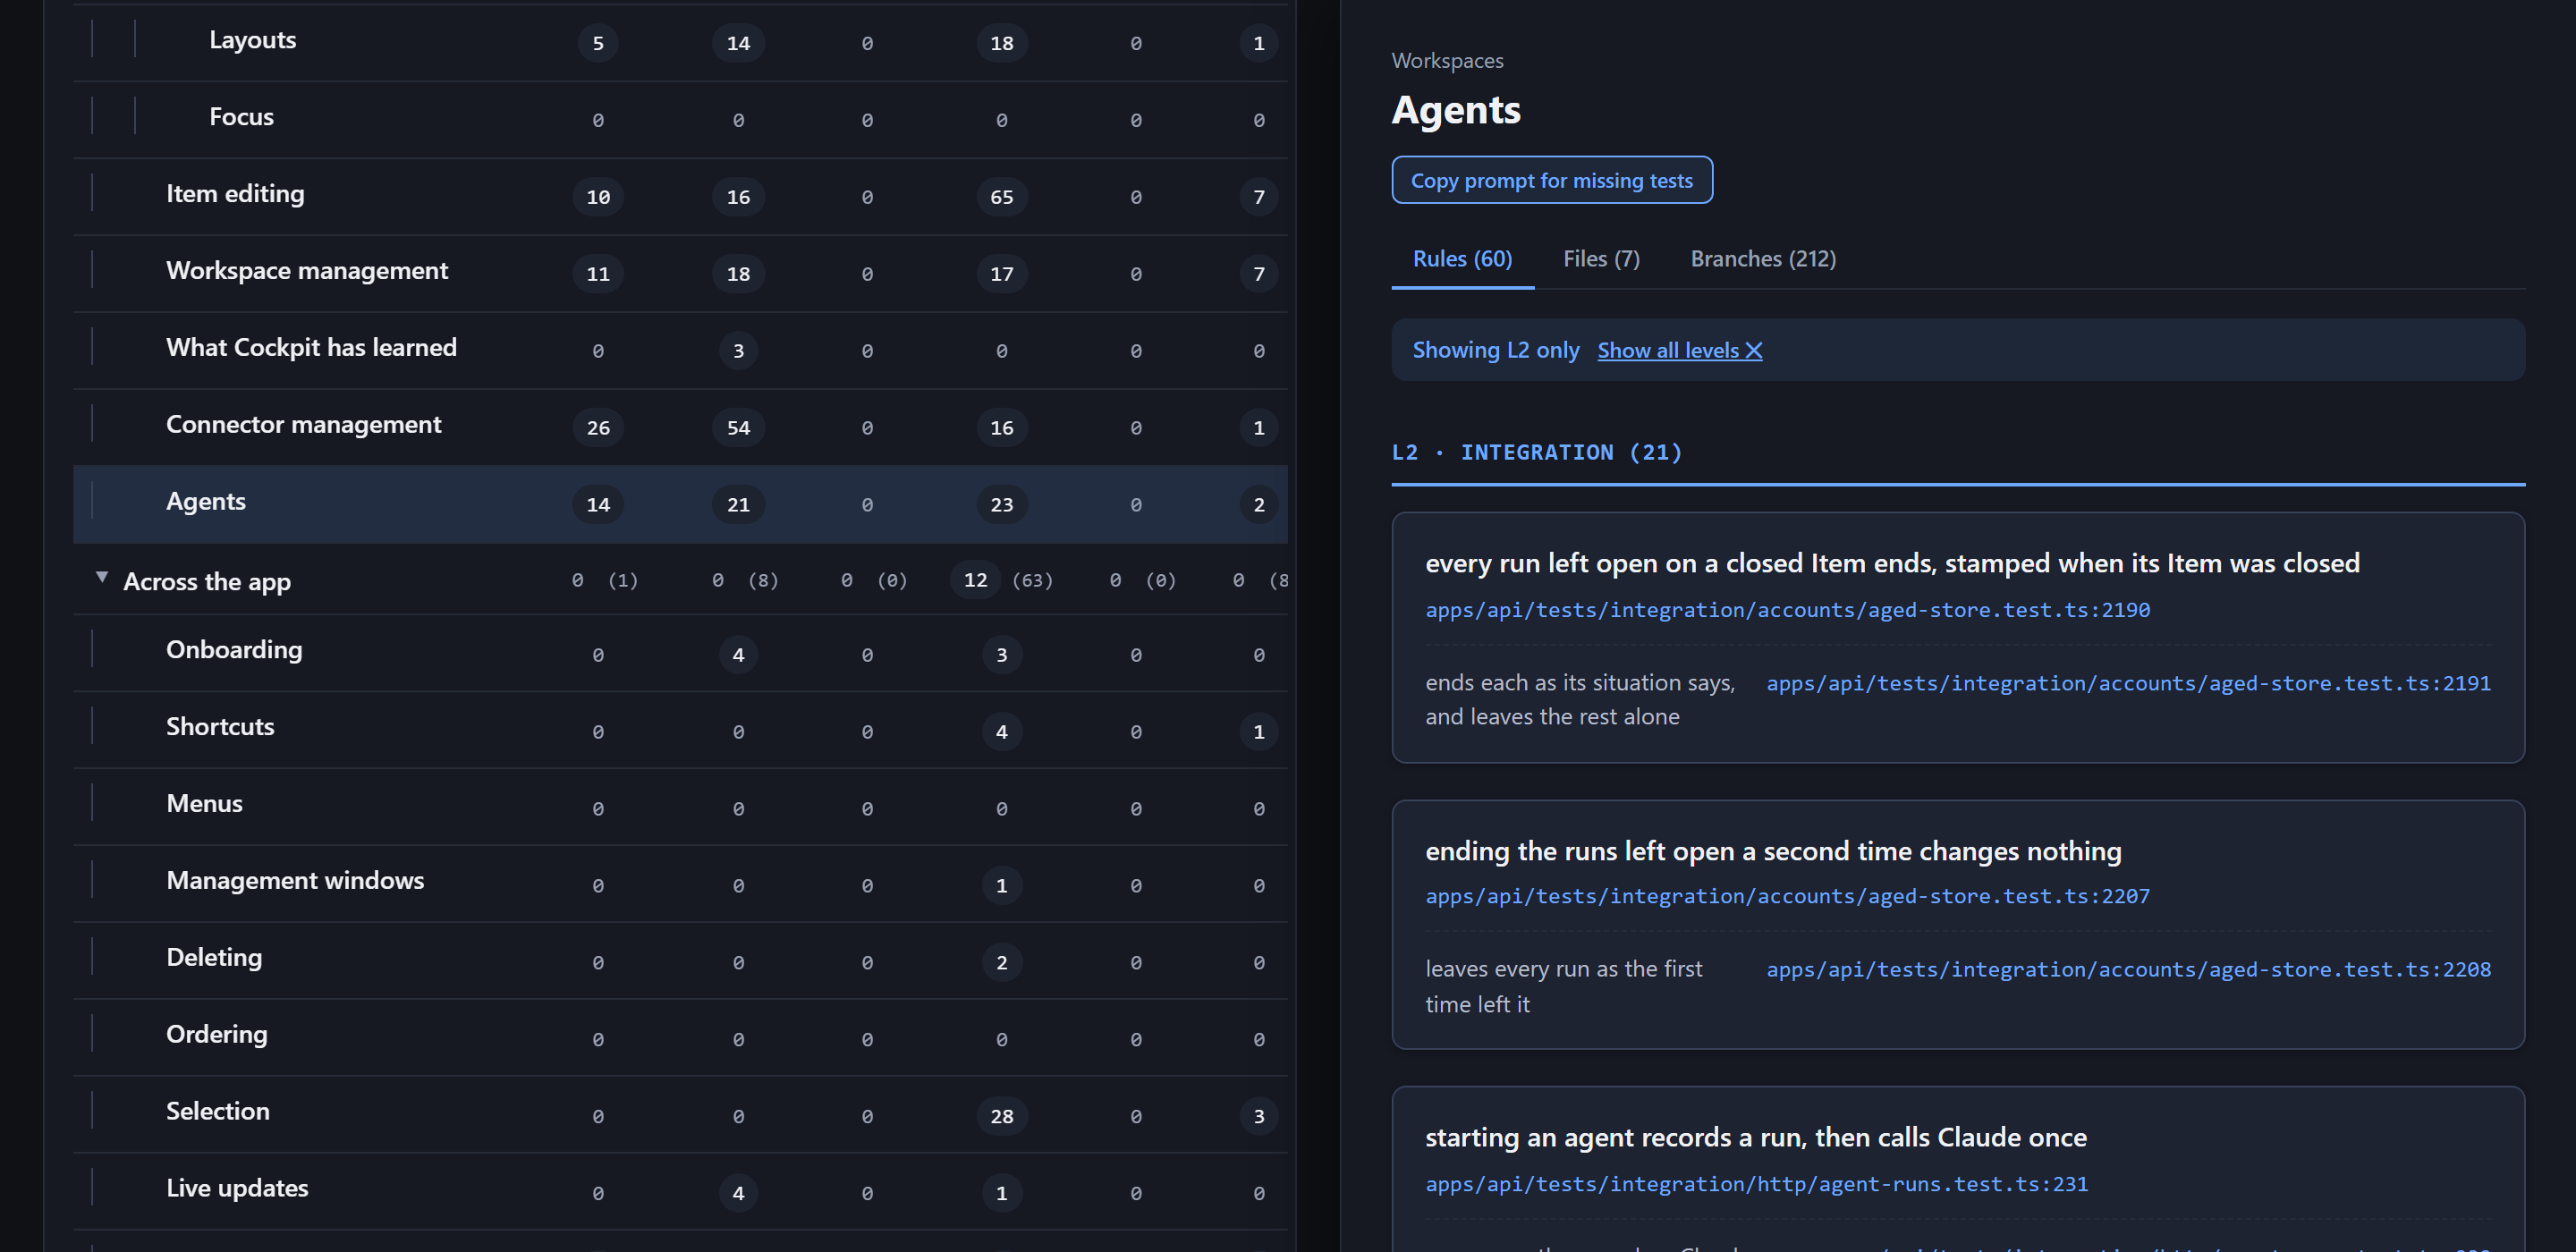
Test coverage: feature areas against test levels, with Agents opened on the right, listing its integration rules as sentences, each linked to the test line that proves it.
On 12 October 2026

1,255 business rules proven by tests. Open an area and you read its rules as sentences, like "starting an agent records a run, then calls Claude once". Focus, Menus and Ordering have no tests at all.

Each row is a part of the product as a person would name it, each column a level of test, and each cell counts the rules proven there. Every rule links to the line of the test that proves it.

When one area starts to see too many regressions, I look here to see how well it is covered, and then I know which gap to close.

I no longer read the code

These three diagrams are drawn from the code every night. They are where I check that what got built is what I designed.

Module diagram

How do I know the agents built it the way I designed it?

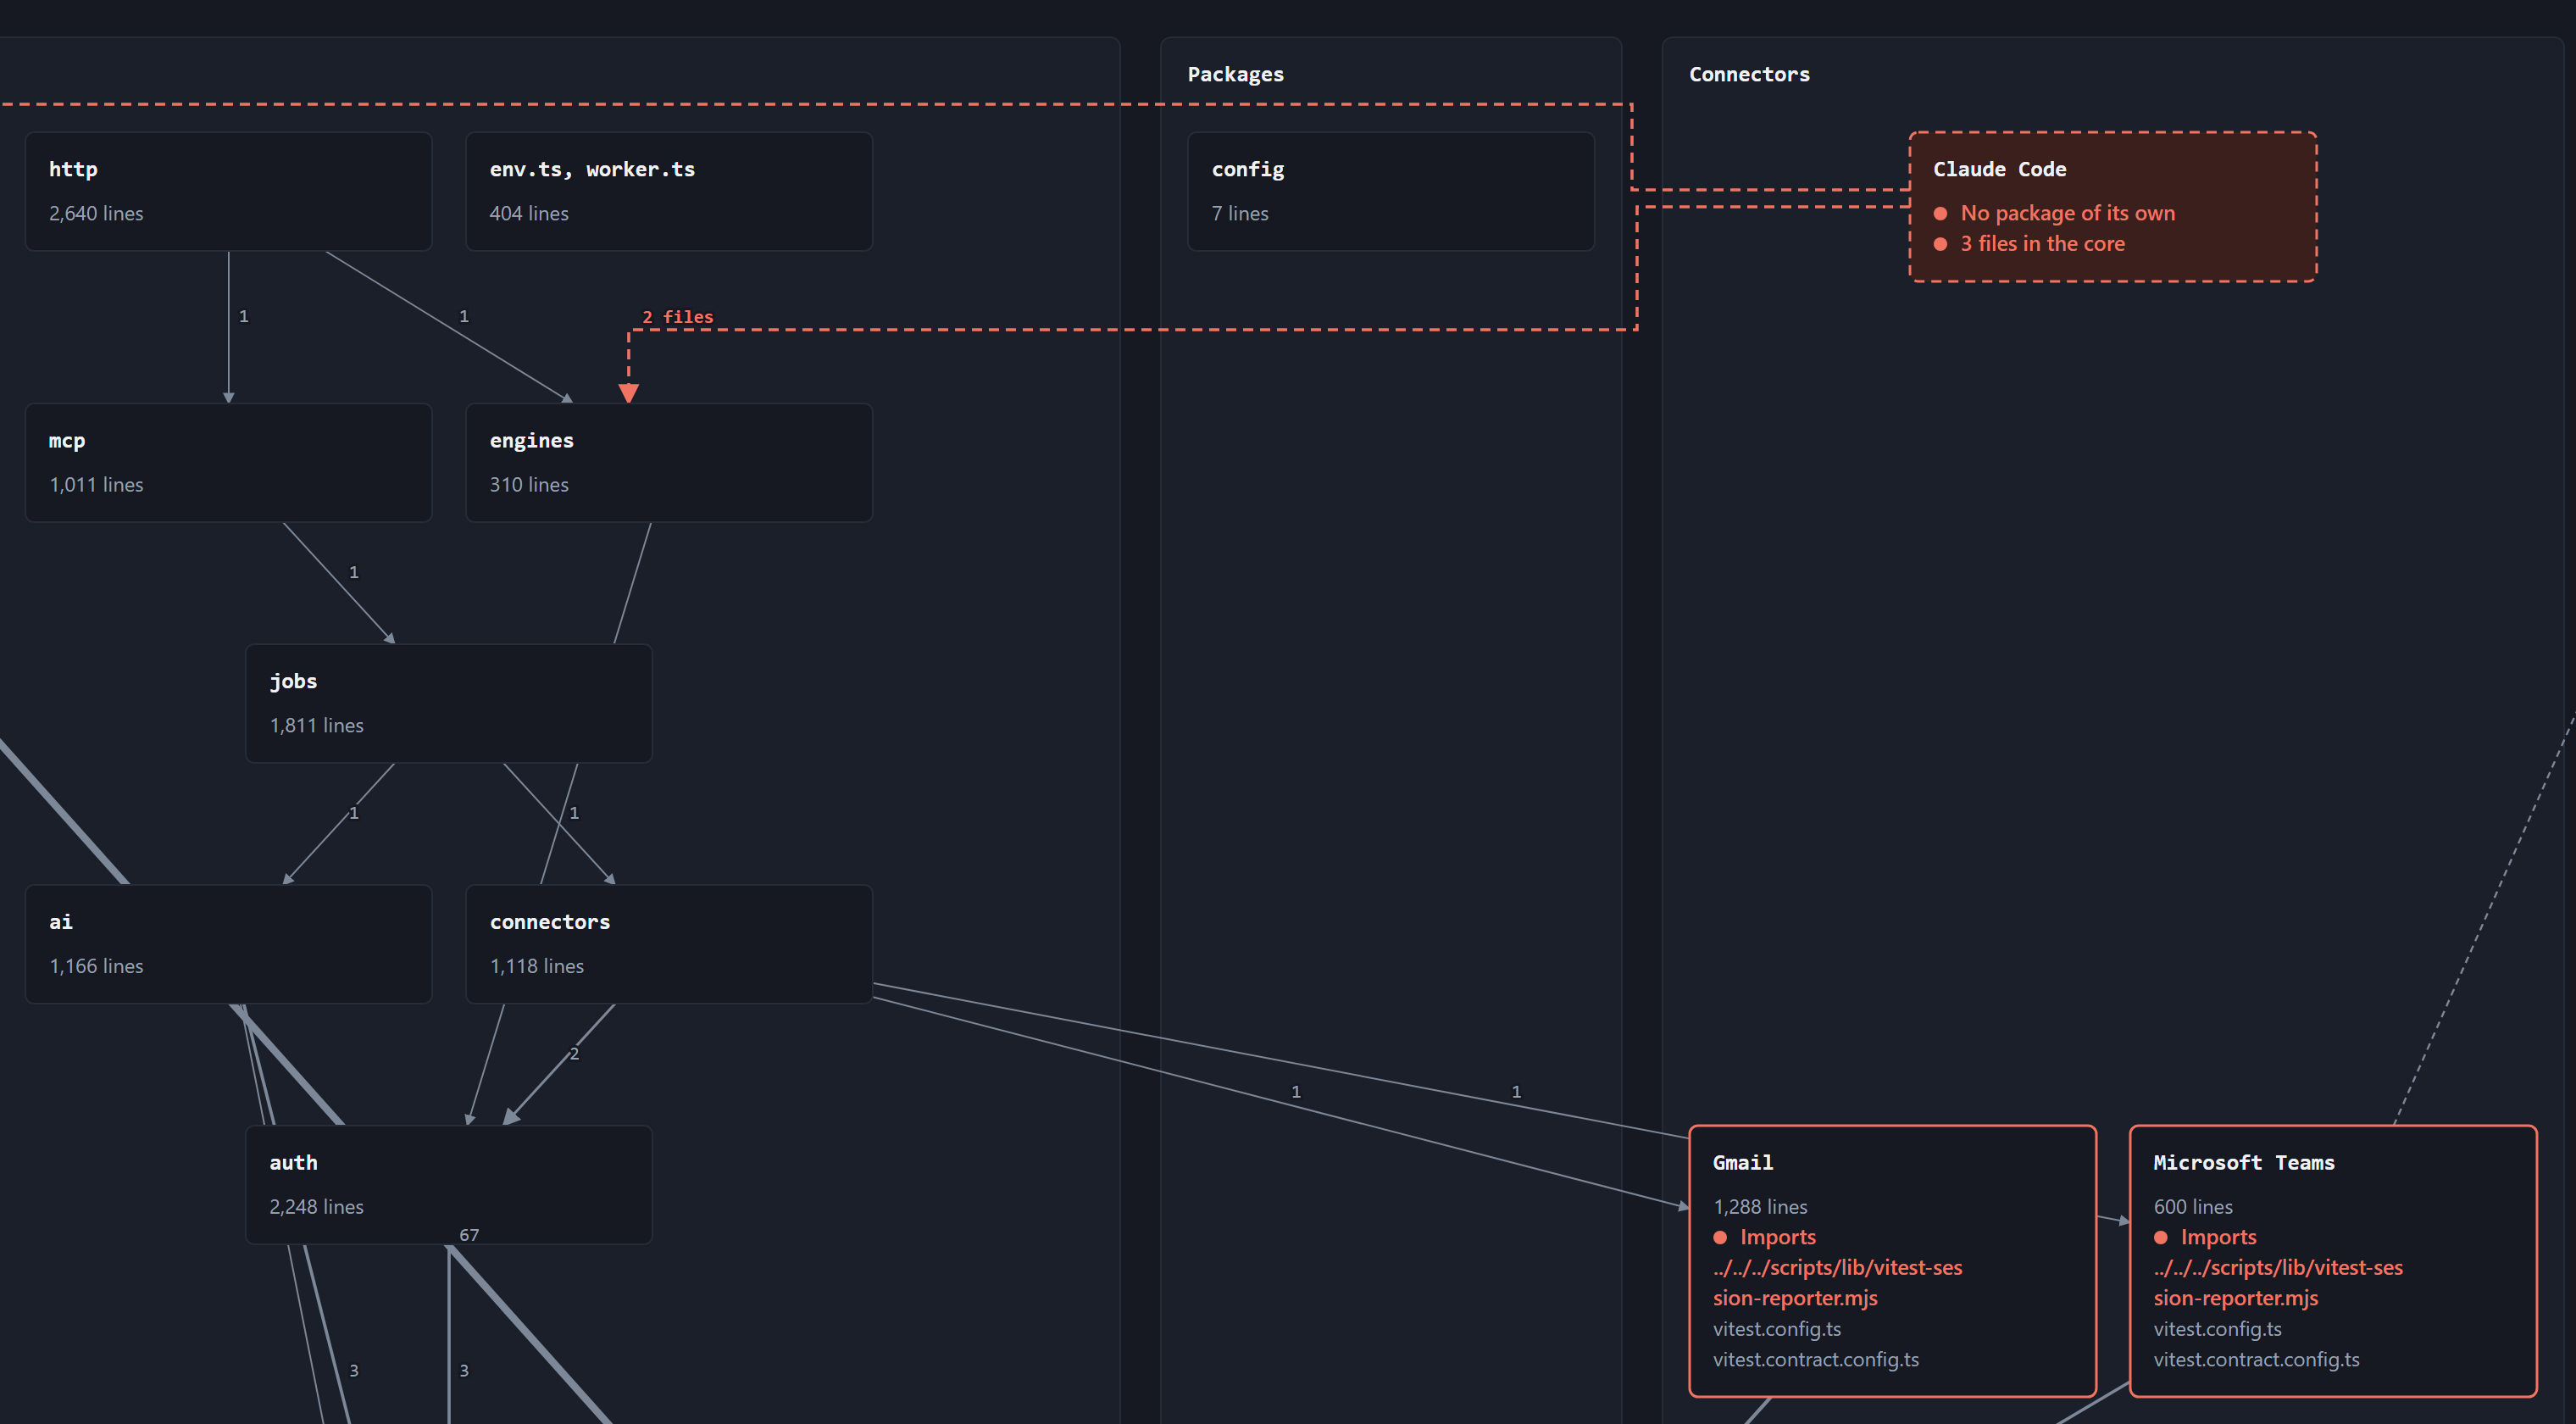
Part of the module diagram: API areas such as http, engines, jobs and auth, each below the areas that import it. A dashed red line runs from the Claude Code connector, which has no package of its own, into engines in the core. Gmail and Microsoft Teams are outlined red: they import a script from outside the connector SDK.
On 12 October 2026

Claude Code has no package of its own: 3 of its files live in the core. Gmail and Microsoft Teams have their own packages, but their test config imports a script from outside the connector SDK.

Every area of the code, each drawn below the areas that import it, with one box per connector. Red marks what goes against the design: an import going back up, or a connector that is not a clean package of its own.

Dependency diagram

Is the code turning into a tangle nobody can change?

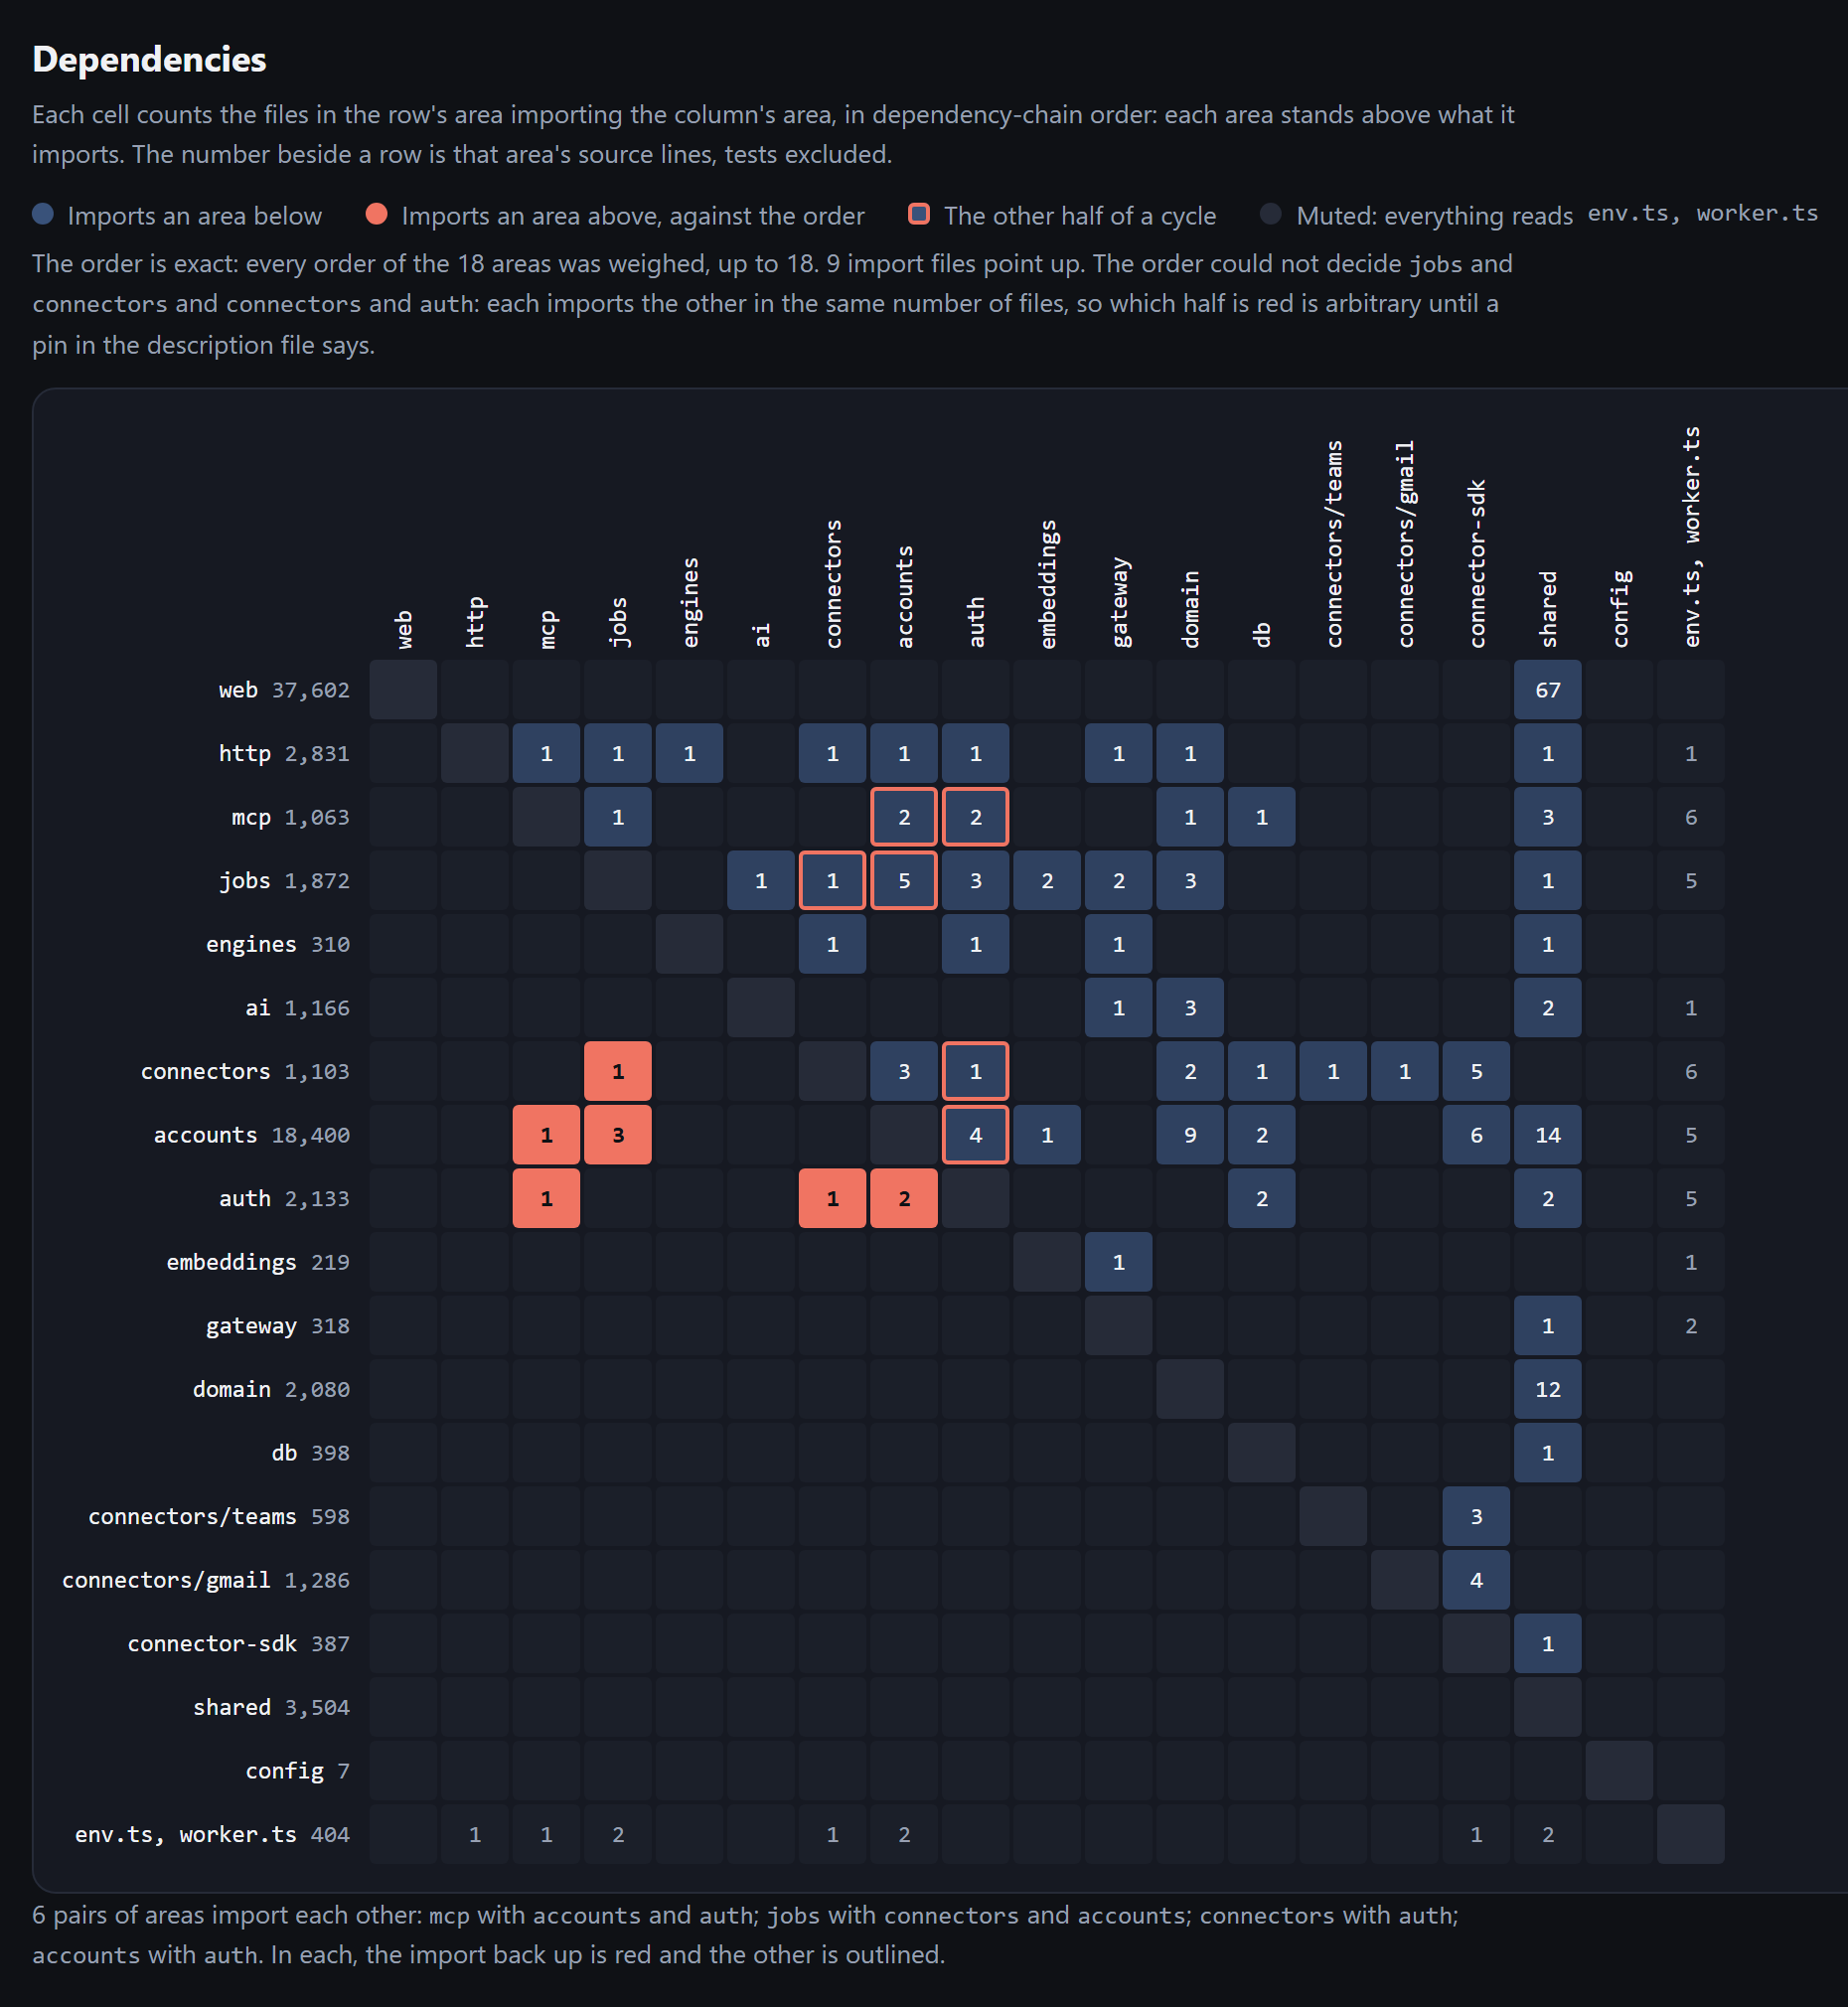
Dependency matrix for Cockpit as it was on 9 October 2026: 18 areas ordered so each stands above what it imports. Red cells are imports against the order and outlined cells their other half; the page lists 6 pairs of areas that import each other.
On 9 October 2026

Six pairs of areas imported each other, such as accounts and auth, and 9 files imported against the order. Two days later every one was gone, and CI now fails any import that points up. The live report shows a clean matrix.

Which area imports which. The areas are ordered so each one sits above what it imports, and each cell counts the files that import across. That makes a dependency in the wrong direction stand out:

  • a red cell is an area importing one above it;
  • an outlined cell is the other half of that import, so two areas depend on each other and neither can be changed or tested on its own.

Deployment diagram

Is what I test on staging the same as what runs in production?

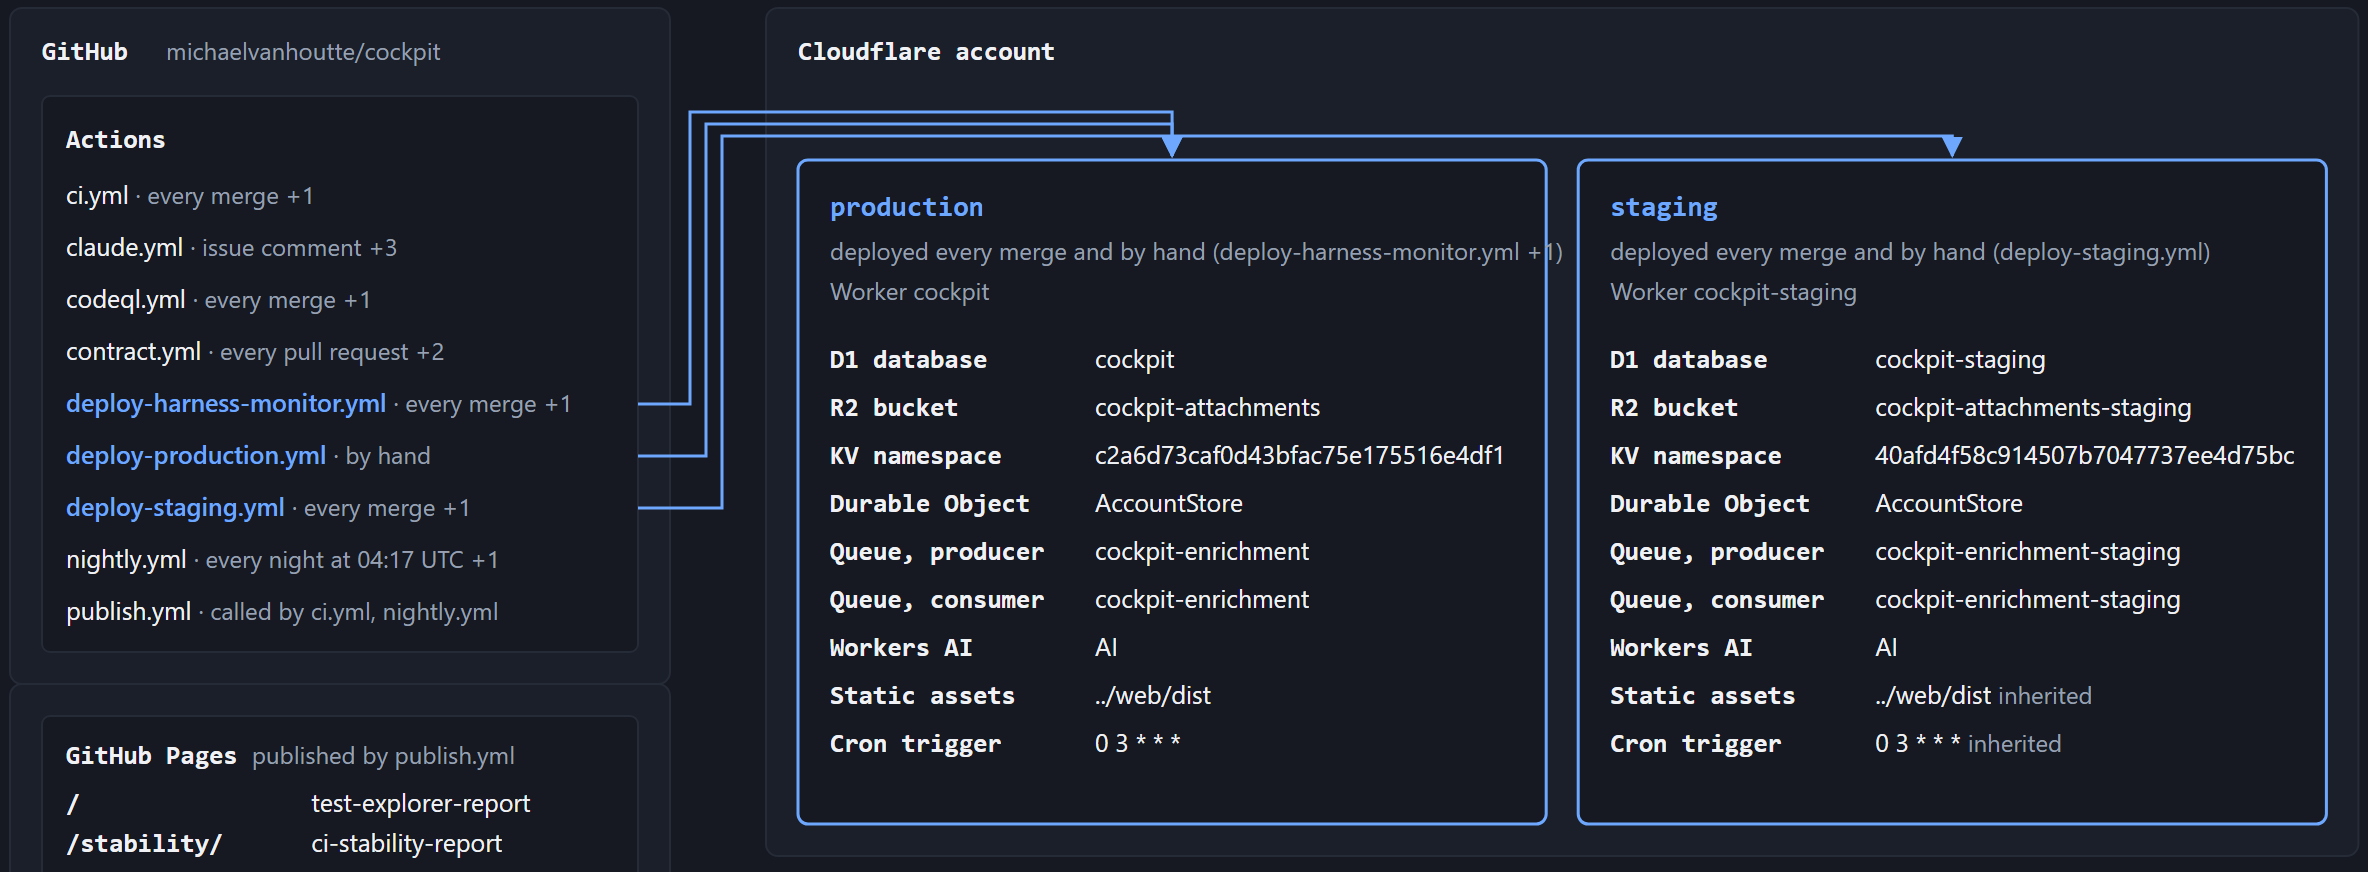
Deployment diagram: the GitHub workflows on the left, arrows from the deploy workflows to the production and staging environments in the Cloudflare account, each listing the resources it binds.
On 12 October 2026

Production and staging bind the same nine kinds of resources, from the database to the queues and the nightly schedule, each under its own name.

Which workflow deploys to which environment, and what each environment uses, read from the Worker config and the workflows. I use it to check that a change in how we deploy is the change I expected.